Biodegradable plastics have emerged as a potential solution to the severe environmental problem
caused by the production and disposal of traditional plastic. These
plastics can be made from natural sources like plant-based materials and
micro-organisms such as bacteria that can be used in a variety of
industries such as packaging, construction, and healthcare. While
plastic pollution remains a significant issue, biodegradable plastics
and enzymatic plastic recycling offer promising alternatives.
For every human on this planet, there are 21 000 pieces of plastic in the ocean. If a legally binding global plastic treaty doesn’t come to fruition, plastic in the oceans will almost triple by 2040.
And most of those pieces are tiny, and can’t be recycled. Humans
produce over 300 million tons of plastic waste every year, with only 9% of it being recycled and about 19% incinerated to generate energy, according to the Organization for Economic Cooperation & Development.
Traditional plastics are non-biodegradable, meaning they do not
decompose naturally in the environment. Instead, they break down into microplastics that pollute our ecosystems and pose a risk to human health.
As a result, plastic waste has found its way into our oceans, forming massive garbage gyres and causing harm to marine life. The Great Pacific Garbage Patch,
the largest accumulation of ocean plastic, is estimated to be twice the
size of Texas. Fortunately, scientists, entrepreneurs, and companies
are developing biodegradable plastics and recycling technology (using
pyrolysis and enzymes) to help mitigate the plastic pollution problem.
The Promise of Plant-Based Plastics
Biodegradable plastics, also known as bioplastics, are made from renewable resources such as plant-based materials, and they can break down naturally in an industrial composting facility.
They offer a more sustainable alternative to traditional plastics,
reducing the amount of plastic waste that ends up in landfills or
pollutes our oceans.
There are different types of bioplastics, each with its unique
properties and applications. For instance, polyhydroxyalkanoates (PHAs)
are produced by microorganisms such as bacteria and can be used for
packaging, agriculture, and medical devices.
Polylactic acid (PLA) is another common bioplastic made from
renewable sources like corn starch, which can be used for food
packaging, 3D printing, and textiles.
Starch-based bioplastics made from corn or potato are used for food
packaging and bags. Mushroom-based foam, made from the mycelium of
mushrooms, can be used for packaging and insulation. Algae-based
bioplastics are another emerging type of bioplastic, with potential
applications in packaging, cosmetics, and pharmaceuticals.
At the Forefront of Bioplastics
Many companies are already using biodegradable plastics to reduce
their environmental impact. For example, Dell is using mushroom-based
foam for packaging to protect tech during transport. Lego has committed
to using bioplastics made from sugarcane for sustainable Lego bricks.
Speaking to Earth911 on our podcast, Algenesis CEO Steve Mayfield describes how the company developed a biodegradable polyurethane foam called Soleic used in the soles of the world’s first biodegradable shoes made by sustainable shoe company Blueview Footwear.
“Soleic is made from sun oils, which means oils that come from
plants. We started with algae, we still work on algae oils, because
those will ultimately be the most sustainably sourced oil on the planet.
But we also use non-food plant oils … we don’t use palm oil or soybean
oil, but any other plant oil will work to make our material,” Mayfield
said. Solei breaks down the fastest in compost, where the shoes become
unrecognizable in nine months.
“In the ocean, it [disappears] at about half that speed … because the
ocean’s air exchange isn’t as good as it is in a compost pile. Oceans
are also missing a couple of key things that organisms need, so one of
the things that we work on now is what can we add to our foams to get
them to degrade faster. And iron, it turns out, is one of the key
minerals missing in the ocean. So if you put iron into the foam, they
actually degrade at a much quicker rate,” Mayfield explains.
Companies like Nestlé have committed to 100% recyclable or reusable
packaging by 2025. They’re exploring the use of biodegradable and
compostable plastics in their packaging. But when will recycling plastic
become viable?
Tackling Plastic Pollution Through Recycling Technology
Recycling traditional plastics can be difficult and expensive, which
is why new recycling technologies are deployed to make the process more
efficient and sustainable. Earth911 spoke to Jeff Gold, CEO of Nexus Fuels, which uses molecular recycling/pyrolysis technology to break down 50 tons of plastic daily to be reused in new plastic.
Pyrolysis technology uses heat to break down plastic polymers (the
chains of molecules) into smaller chains, which are condensed and cooled
to form oils, waxes, and non-condensable gases like propane and ethane.
Pyrolysis heats plastic without the presence of oxygen, so it doesn’t
produce the toxic emissions that would otherwise result from heating
plastic.
“All that material is captured … the oil and the wax products we make
and ship off are then handled by a refinery where they are made into
new plastic. The gas products, the ethane and propane, we capture every
bit of that, because [it is] then routed back to our reactors where it
is combusted and provides the heat for our process,” Jeff Gold explains.
Jeff continues, “We’ve created about 350 000 gallons of product and
diverted 3 million pounds of plastics that would have normally gone to
the landfill … We are taking plastics out of the environment and
sequestering that carbon (it’s not going into the atmosphere) and making
new plastics that can be recycled infinitely.”
Plastic Recycling Using Enzymes
Enzymatic recycling
is a technology using special proteins called enzymes to break down
plastic waste into smaller building blocks called monomers. Carbios, a
French biotech company, has developed an enzymatic recycling technology
that can recover over 95% of material from polyethylene terephthalate (PET), a common plastic used in beverage bottles and packaging.
Carbios’ technology uses enzymes that break down PET into its
building blocks, which can then be used to create new products. The
process is better for the environment because it does not require high
temperatures or harsh chemicals, and, unlike mechanical recycling, the
resulting plastic can be used repeatedly without losing its chemical
coherence.
The Outlook for Circular Economy Plastics
Despite their promise, biodegradable plastics and enzymatic recycling technologies are still costly and resource-intensive
to build and operate. It remains an open question whether biodegradable
plastics will be as durable or versatile as traditional plastics.
While there are current economic and technological challenges
associated with the production of biodegradable plastics, it is clear
that there is a growing need for more sustainable packaging solutions.
The recently ratified
global plastic pollution treaty, which has been signed by over 170
countries, includes legally binding commitments to end plastic pollution
and promote the use of more sustainable materials.
What an interesting article, I loved it, it shows that there are people out there trying to make a difference. We all need some good news regarding the monster (AKA plastic) that we have created. If only we knew then what we know now, but saying that would things have been any different. We are the problem, the people who keep buying these products. All in all a fantastic report (as we have come to expect) from our friends at earth911.com.The blog song for today is: "Burning Love" by Elvis PresleyTTFN
Remember the children’s book Everyone Poops?
Written by Taro Gomi, it shows all kinds of animals, including humans,
in action. The reader sees animals pooping in water, on the move, and
covering up their business with dirt. In the end, people are shown using
the toilet, toilet paper, and flushing away.
We’re all for keeping things clean “down there,” but our use of TP is leaving behind some pretty dirty business.
What’s So Bad About Toilet Paper?
Toilet paper has such a large environmental impact that the Natural Resources Defense Council (NRDC) published not one, not two, but three reports in three years about the crisis.
Americans are the heaviest per capita users of toilet paper in the world. Most major U.S. brands rely on wood from the Canadian boreal forest. This forest is particularly important from a climate standpoint. According to NRDC reports:
“This great northern forest is the most carbon-dense, intact
forest left on the planet, locking up in its soils and trees twice as
much carbon as the world’s oil reserves.”
Logging in the boreal forest releases an estimated 26.4 million metric tons of carbon dioxide into the atmosphere. That’s roughly a quarter of all the carbon emitted from all the trucks in cars in the U.S. in 2019. Among the ways that toilet paper adds carbon into the atmosphere:
Logging disrupts carbon within the soil.
The forest’s ability to absorb carbon is reduced.
When the TP breaks down, it releases more carbon.
It’s Made With Mostly Virgin Fibers
We’re finally having a national and global conversation about
reducing our consumption of resources. Yet there is little progress in
replacing virgin fibers with recycled paper content for toilet paper.
TP manufacturers rely heavily on virgin wood fibers to create their
products. They are reluctant to seek alternatives due in part to
consumer demand and expectations. Yet using post-consumer recycled
content has significant benefits. Toilet paper made with post-consumer recycled content:
Has a smaller carbon footprint
Requires less energy to clean and separate fibers
Uses fewer harsh chemicals, including bleach, in its processes
Uses less water
How Much TP Do We Use?
Each person in the U.S. uses an estimated 141 rolls of toilet paper per year. Despite accounting for about 4% of the global population, Americans use 20%
of the world’s toilet paper. Disturbingly, if you measured the toilet
paper an average American uses in their lifetime, it would equal about 634 miles.
Looking at that another way, it takes one tree to make roughly 1,500 rolls of toilet paper. That comes out to over 31 million trees to make just one year’s supply of TP for everyone in the U.S.
The average per-person use of TP in Portugal, Germany, and the U.K. is 137, 134, and 127 rolls, respectively.
Not everyone uses this much TP, though. A recent study
looked at the average use of this paper product throughout the world
and found that Italy, France, and Finland use less than one-half of the
amount we use in the U.S. Many countries use even less. Check out the
study’s per-country usage findings in the following interactive chart.
And in some places, people don’t use any toilet paper.
Everyone Poops — But Not Everyone Uses Toilet Paper
While pooping is universal, using toilet paper isn’t. Less than 30%
of the world’s population uses toilet paper. That leaves a whopping 4
billion people who don’t. In some places, it’s because of access. People
either don’t have money to spend on TP, or there’s none to be had. In
other places it’s cultural.
What do people use instead? Mostly water.
Give Bidets a Try
In countries across Asia, Europe, and South America, people use bidets instead of toilet paper. Bidets come in many forms. All of them involve spraying water on your bottom to keep it clean.
Bidets are catching on slowly in the U.S., due to their lower environmental impact. Even Forbes magazine advocates switching to a bidet. They state that bidets are “more hygienic and better for the environment.”
(There are health conditions that bidets are not recommended for, so check with your physician before using one.)
Not a Fan of Bidets? Try Better Toilet Paper
We’re creatures of habit. We don’t like change, so a large-scale
switch to bidets isn’t likely anytime soon. But switching toilet paper
brands isn’t such a big change.
If you can’t imagine not wiping your backside, there are better-for-the-planet TP brands. Earth911 has a buying guide to help you find more sustainable TP brands. The guide ranks brands according to several factors:
Raw materials sourcing
Manufacturing process impacts
Price
Shipping distance
Life cycle of paper and packaging
Distribution distance
CO2 emissions
The guide also looks at certifications and charitable giving for each company. Reel, Bim Bam Boo, and Who Gives a Crap earned the highest marks.
Consider Using Less Toilet Paper
If nothing else, be conscious of how much TP you use. Do you really
need a huge cushion of squares for a single wipe? Several readers have
suggested that using single-ply toilet paper can reduce the
environmental impact but a recent University of Pennsylvania study found that there was no substantial difference in single-ply versus double-ply. Single-ply TP is better for septic systems but people tend to use more paper if it is thinner.
The biggest change starts with your bathroom habits. By paying
attention, you may discover you automatically rip off more squares than
you really need for a given wipe. And reducing your use of TP isn’t just
better for the planet; you’ll save money, too!
This article was originally published on March 10, 2022.
If you stopand think that really is a lot of toilet paper that gets flushed away!!
The blog song for today is: "Astronomy Domine" by Pink Floyd
DIY
EcoTech
Home & Garden
How & Buy
Living & Well-Being
Carbon Calculating: Estimating Your Home Energy Impact
ByMitch Ratcliffe
Feb 20, 2023carbon calculator, carbon-footprint-energy, home energy
The dozens of carbon
calculators available as apps and on the web provide widely divergent
estimates of your carbon footprint. Whether you choose to use one of the
many calculators or want to assemble your own estimate — from finding
and understanding your home energy usage to assessing a carbon
calculator’s results — this article will break down how to track the
impact of home electricity, natural gas, fuel oil, or propane use.
As mentioned in the first article in this series,
carbon calculators use different formulas and estimated CO2 emissions.
We entered the same data in five web-based carbon calculators and
received strikingly different total emissions estimates, as well as
radically different shares of the total carbon footprint attributed to
home energy use. The differences raise significant concerns about the
accuracy of each of the calculators.
Earth911
compared six web-based carbon calculator estimates of home energy
emissions, shown here compared to the total carbon footprint reported
for the household. Karma Wallet does not break out the energy total.
(Click for a larger image.)
Each calculator we tested has strengths and weaknesses. The reality
is that you will probably need to use parts of several calculators to
get the most accurate cumulative carbon footprint for your household.
Before we explore which ones offer the most trustworthy home energy
estimates, let’s walk through the information you need to have at hand.
If you are a DIYer, you will find the formulas for making your own calculations at the end of this article.
Collecting the Data
To get started, find your utility bills to help you determine your
home energy use. Try to collect a full year’s worth of your electric
bills as well as other energy bills, such as fossil fuel, natural gas,
fuel oil, or propane. Carbon calculators ask for this information by
month or as an annual total.
Electricity
Your electricity bill presents power consumption in kilowatt-hours,
which represent the number off watts of energy needed to power a
1,000-watt microwave oven for an hour, for example. Look for “kWh” on
your electricity bills, add up a year’s worth of bills to arrive at the
annual total, then divide by 12 to get your monthly average electricity
consumption. Whether the calculator you use asks for monthly or annual
kilowatt-hours, you’re ready.
Most carbon calculators ask for electric data in kWh, but you may
also find calculators that ask for your monthly or annual spending on
electricity. Based on our experience, spending is a less reliable way to
estimate electricity usage than exact usage based on kWh because local
rates vary. Calculators that use spending must apply guesswork to
estimate your usage.
In addition to your electricity usage, the source of your power makes
a big difference to your environmental impact. If you get a significant
percentage of renewable sources, such as hydro-electric, solar, or
wind, the energy footprint is lower than someone who relies on fossil
fuel generation.
Only two of the calculators we used, Doconomy and the EPA’s, asked
about use of renewable energy. However, Doconomy asks only if you have
renewable energy, not the percentage of electricity that is renewable,
allocating CO2 emissions based on the assumption you either have access
to all-renewable or no renewable energy. A simple yes/no question
doesn’t deal with our realities. The EPA calculator, on the other hand,
asks you to enter the specific percentage, which we recommend to ensure
you get an accurate emissions report.
Local renewable percentages depend on your utility’s decisions about
how to generate or where they buy energy. For example, where we live, in
Western Washington, Pierce County enjoys 89% renewable energy while in
Eastern Washington, Whitman County gets only 41% of its power from
renewables. But statewide, the typical resident’s renewable energy
percentage is 85% because most of the population lives on the western
side of the state, where renewables dominate.
Many utilities will list the percentage of renewable energy you
receive on your bill or in an annual customer report. If you don’t know
your local renewable percentage, the U.S. Energy Information Administration provides state-level information
about electric energy sourcing. Click on your state and choose the
Electricity tab in the state report. You will have to do a bit of math
to calculate your renewable percentage by mousing over the bar in the
chart seen below to get the data about all your power sources.
The EIA’s state-level data can be used to estimate a renewable energy percentage for use in a carbon calculator.
Natural Gas
Methane gas, or “natural gas,” consumption is presented in several
different units including therms (each therm equals 100,000 British
thermal units, the equivalent of heat created by 29.3072 kWh of
electricity), “ccf,” which represents hundreds of cubic feet of gas
delivered per month, and “mcf,” which counts cubic feet by thousands.
You may need to convert ccf into mcf, or vice versa, to use a
specific calculator — pay attention to the unit of measure requested
because entering your gas usage in the wrong unit can throw your impact
results off by a factor of ten. To convert ccf into mcf, divide by your
total ccf by 10; going the other way, multiply your mcf by 10 to get
total ccf.
Fuel Oil
Burning oil to generate heat in the home
has been on the decline since the oil crisis of the 1970s. But several
states still see significant use of oil, including the top five (in
order): New York, Massachusetts, Pennsylvania, Maine, and Connecticut.
You will enter your fuel oil usage in gallons or by the dollaramount
you spend — that data will be shown on your bill. Add up a year’s worth
of bills and divide the total by 12 to get an average monthly fuel oil
usage to use in your calculation. And because local rates vary, we
recommend using the actual volume of oil and not the monthly spending
for more accurate results.
Propane
This form of gas, which differs from methane chemically, is still in
use in tens of millions of homes in the U.S. All the carbon calculators
we tested that included propane as an option requested either a monthly
or annual volume in gallons.
The Calculators
For this article, we focused on calculators offered on websites, but
app-based calculators behave in similar ways. In the final article in
this series, we will present a review of all the app and web calculators
tested.
Environmental Protection Agency Carbon Calculator
Grades Energy estimate:A- Total footprint estimate:D-
The EPA Carbon Calculator
asked for the most information, including the percentage of renewable
energy in your home’s electricity supply, to estimate energy-related
emissions. The renewable energy data we entered clearly reduced the
total energy footprint estimate for our three-person household. When we
compared the EPA’s energy results to our manual calculation, it was the
closest estimate received, followed by the Wren calculator.
Unfortunately, the EPA calculator does not cover all the categories of
emissions necessary to provide a comprehensive footprint estimate.
Because it does not cover all the ways we generated emissions,
offering estimates only for home heating and energy, driving, and the
impact of recycling choices, the EPA calculator does not help
individuals make many decisions that could reduce their environmental
impact. It misses too many emissions.
CoolClimate Network
Grades Energy estimate:C+ Total footprint estimate:B+
A project of the University of California, Apple, Meta, and the Nature Conservancy, the CoolClimate Household Impact Calculator
provides the most detailed analysis of all aspects household carbon
impacts in this review. While the home energy estimate includes entries
for number of people in the household, percentage of renewable energy
used, and volume-based entries for electricity and natural gas use, the
estimated footprint for our home energy was clearly too low,
representing only a third of the emissions actually generated.
The CoolClimate calculator does a great job by providing many
detailed entries for air travel; number and type of vehicles driven;
meat, dairy, and fish consumption; and spending on goods and services,
for example. However, it also inserts arbitrary assumptions that cannot
be adjusted for annual construction, furniture, and clothing spending
that added 15% to our estimated total footprint. If those entries were
customizable, the calculator would be even better.
Another shortcoming is a lack of a clearly defined methodology.
CoolClimate points to a research paper that explains how models can
predict carbon emissions but does not address how the estimate is
generated. Note that this calculator asks for gas usage in cubic feet,
not ccf or mcf. If your bill provides usage information in ccf, multiply
by ten before you enter your data; if your bill displays mcf, multiply
by 100.
TerraPass
Grades Energy estimate:D- Total footprint estimate:D+
In the first article in this series, we pointed out that calculators
tied to the sale of carbon offsets typically make substantially higher
estimates than calculators that do not offer offsets. TerraPass’ Individual Calculator
results don’t make clear sense in two ways. Based on the same data we
entered in the other calculators, TerraPass presents a total footprint
that is almost twice the amount of the next highest estimate.
Compounding our confusion, the TerraPass energy-related results account
for 90.2% of the total emissions — home energy usage should reasonably
be half or less of a total carbon footprint.
TerraPass does not account for use of renewable energy. And like the
EPA calculator, TerraPass does not collect any food, shopping, or
services data, which are essential to understanding your total
footprint. On the other hand, the TerraPass estimates for driving and
air travel are solid. They ask for specific information about what kind
of cars you drive and the number of length of flights you take annually
to deliver largely accurate estimate of travel impacts.
Doconomy
Grades Energy estimate:D Total footprint estimate:F
Doconomy and the United Nations partnered to create a European focused carbon calculator
that covers a wide range of household impacts, including energy,
driving, air travel, food, and shopping choices, as well as the
emissions created by the services you use. However, every aspect of the
tool produced surprisingly low emissions estimates. For example,
Doconomy estimated that our annual home energy impact is only 3,840
lbs., and our food-related emissions only 540 lbs. That’s clearly
incorrect and results in a very low estimate compared to the other
calculators and our manual estimate of emissions. The low estimate may
make you feel better about yourself, but you’ll be unprepared to make
changes that lower your impact.
As noted in the discussion of electricity, Doconomy asks whether you
buy renewable energy, treating your yes or no answer as representing
100% of the power used, according to its published methodology.
Except for a home that relies only on its solar or wind generation
capacity, Doconomy’s assumption about renewable energy is not applicable
to anyone connected to the grid. One positive: Doconomy sells offsets
but delivered the lowest estimated overall footprint among the offset
vendors reviewed in this article. We’d like to see them refine and
improve the formula and assumptions that drive their results.
Wren
Grades Energy estimate:B- Total footprint estimate:C
Another carbon offset seller, the Wren carbon calculator
provides one of the most comprehensive assessment of a household’s
carbon impact. In addition to home energy estimates, Wren calculates
driving and air travel emissions, as well as food (including pet food),
shopping, and services impacts. The site’s total annual estimate was the
third highest, but far more conservative than TerraPass and Karma
Wallet. However, Wren does not publish its methodology, so it is
difficult to validate its estimates. Its home energy estimate is based
in part on the ZIP code entered. In our case, adding the ZIP code
lowered our estimated impact by 31.6%.
Karma Wallet
Grades Energy estimate:F Total footprint estimate:D+
The Karma Wallet calculator
takes a completely different approach than the manual-entry calculators
above. It analyzes your spending by tracking credit card and bank
transactions. As we’ve noted about spending-based estimates, it is
impossible to extrapolate with useful precision the amount of
electricity, natural gas, or other units of energy used from the price
paid without extensive context. Karma Wallet does not break out the
individual categories of emissions, providing only a total emissions
estimate. Our Karma Wallet results were 23.2% higher than the average
reported by all the other calculators reviewed here.
Karma Wallet offers two way to take action. It suggests alternatives
to your current spending, such as switching from one wireless carrier to
another (with cashback offers), and provides offsets for purchase. The
guidance about choosing more environmentally responsible companies to
buy from would be useful if the actual impact of those choices was
clearly presented, but the tool only compares a sustainability rating
without explaining how a change reduces carbon emissions. This
potentially useful tool requires the user to take too much on faith
because there is no quantitative data about categories of your current
carbon impact or how making changes will reduce emissions.
The DIY Way
Checking the work of third-party calculators can help you make
confident decisions. But we know doing the math isn’t everyone’s cup of
tea. If you’d like to do your own estimates, here are simple formulas
for calculating the sources of each of the major types of home energy.
For example, when calculating a carbon footprint for a home that uses
electricity and natural gas, you’ll need to add the totals for all the
energy sources to arrive your cumulative home energy footprint.
We’ve provided average emissions factors for each type of energy based on the EPA’s reporting.
Keep in mind that local factors, such as the condition of your furnace
and specific sources of gas, oil, or renewable energy affect your actual
impact. Alas, estimates are not reality. We recommend asking your local
utility for the emissions factors of their energy sources to improve your estimate.
Electricity, No Renewable Sources
Depending on what your utility burns to generate electricity, the
emissions will vary. Here are formulas for three common fuels used to
generate electricity in commercial plants.
The EPA reports the emissions factors for combustible fuels in
millions of British Thermal Units (mmBtus). We included a step to
convert the hours reported on your electric bill into the equivalent
mmBtus, which involves multiplying the number of kWh by
0.0034095106405145. The EPA also provides emissions factors per mmBtus
are provided in kilograms, so the final step, multiplying the result by
2.2046, converts the result in kilograms to imperial pounds. If the U.S.
would embraced the metric system, this would be easier. When using a
calculator, enter the values in BOLD below.
Mixed Coal
The energy industry typically uses mixed coal, which has an emissions
factor of 95.52 kg per mmBtu, to power electricity generation plants.
The formula to find your home’s energy emissions is:
CO2 emissions (in lbs.) = (YOUR TOTAL ANNUAL kWh) * (0.0034095106405145 MMBtu/kWh) * (95.52 kg CO2/MMBtu) * 2.20462
Natural Gas
Many utilities burn natural gas in peaker plants, which come online
during periods of high demand. But some utilities rely on natural gas
around the clock, accounting for 37% of all the natural gas burned in
the U.S., about 11.27 trillion cubic feet in 2021, according to the EIA. If your utility sources most electricity from natural gas, here’s the calculation you need to perform:
CO2 emissions (in lbs.) = (YOUR TOTAL ANNUAL kWh) * (0.0034095106405145 MMBtu/kWh) * (53.06 kg CO2/MMBtu) * 2.20462
Biomass or Landfill Gas
Capturing and burning gasses produced in landfills and from
processing organic waste, sometimes referred to as biogas or renewable
gas, sounds pretty green. But burning fuels emit CO2, regardless of
where they came from. These gasses accounted for about 0.2% of
utility-scale electricity generation in 2021, according to the EIA. Here is the home energy carbon footprint formula for biogas:
CO2 emissions (in lbs.) = (YOUR TOTAL ANNUAL kWh) * (0.0034095106405145 MMBtu/kWh) * (52.07 kg CO2/MMBtu) * 2.20462
Electricity With Renewable Sources
The percentage of renewable energy you use can change your total
energy footprint significantly. To find information about how much wind,
solar, or hydroelectric power your utility uses, along with the source
of the rest of your energy, refer to the EIA website
we mentioned earlier. To find your adjusted emissions based on the mix
of fossil fuel and renewable energy powering your home, we add a step to
the previous fossil fuel calculation (we use mixed coal in this
example), highlighted below in italics:
CO2 emissions (in lbs.) = (YOUR TOTAL ANNUAL kWh) * (0.0034095106405145 MMBtu/kWh) * (95.52 kg CO2/MMBtu) * 2.20462 * 1 – (1 – YOUR RENEWABLE ENERGY PERCENTAGE EXPRESSED AS DECIMAL)
Fuel Oil
A fuel oil furnace operates like a power plant without a mechanism
for converting the heat into energy — it’s heating your house, instead.
The formula is similar to the oil-fired electricity calculation above,
and uses the CO2 emissions factor of 24.78 lbs. of CO2 per gallon:
Total CO2 emissions = YOUR ANNUAL OIL USE IN GALLONS * 24.76
Propane
Propane is easier on the atmosphere but still emits 12.68 lbs. of CO2 per gallon burned. To find your propane carbon footprint:
Total CO2 emissions = YOUR ANNUAL PROPANE USE IN GALLONS * 24.76
It looks quite complicated when you first read it, but I should imagine after a few attempts it will get a bit easier. It would appear that the Wren calculator is one of the best of them. I have yet to try it out for myself, we are in the middle of moving house and the new one is completely solar powered (off grid), so we are a bit busy! We plan on using solar powered generators as back up. There are many more homes on Menorca with solar energy which is great, they are also building solar farms. The blog song for today is: "The tide is high" by BlondieTTFN
Acuerdo histórico de la ONU para el Tratado Global de los Océanos
05-03-2023
Este acuerdo mantiene vivo el objetivo de proteger el 30% de los océanos para 2030
Países como España, entre otros, han sido actores clave para conseguir el acuerdo
Los países ahora deben adoptar y ratificar formalmente el tratado
Nueva York, 4 de marzo de 2023.- Finalmente se ha acordado un histórico Tratado de la ONU sobre los océanos después de casi dos décadas de negociaciones.
El texto pasará ahora por la edición técnica y la traducción, antes de
ser adoptado oficialmente en otra sesión. Este tratado es una victoria
monumental para la protección de los océanos y una señal importante de
que el multilateralismo aún funciona en un mundo cada vez más dividido.
El acuerdo de este tratado mantiene vivo el objetivo 30×30 –proteger el 30% de los océanos del mundo para 2030–
pues proporciona un camino para crear áreas total o altamente
protegidas en los océanos del mundo. Todavía hay deficiencias en el
texto, y los gobiernos deben asegurarse de que el tratado se implemente
de manera efectiva y equitativa.
Reproductor de vídeo
00:00
01:14
“Hoy
es un día histórico para la conservación y una señal de que en un mundo
dividido, proteger la naturaleza y las personas puede triunfar sobre la
geopolítica. Elogiamos a los países por buscar compromisos, dejar de
lado las diferencias y emitir un tratado que nos permitirá proteger los
océanos, aumentar nuestra resiliencia al cambio climático y salvaguardar
las vidas y los medios de subsistencia de miles de millones de personas”, ha declarado Pilar Marcos, responsable de Océanos en la delegación de Greenpeace en Naciones Unidas. “Por
fin podemos pasar de las palabras a un cambio real en el mar. Los
países deben adoptar y ratificar y ratificar formalmente el tratado, lo
más rápido posible para que entre en vigor, y luego poder crear los
santuarios marinos que nuestro planeta necesita. El tiempo sigue
corriendo para poder alcanzar el objetivo de protección 30×30. Nos queda
media década y no podemos ser complacientes”.
La High Ambition Coalition,
que incluye a la UE, EE.UU., Reino Unido, y China han sido actores
clave en la negociación del acuerdo. Ambos mostraron voluntad de
compromiso en los últimos días de negociaciones y han construido
coaliciones en lugar de sembrar división. Los Pequeños Estados Insulares
han mostrado liderazgo a lo largo del proceso, y el grupo G77 ha
abierto el camino para garantizar que el tratado se pueda poner en
práctica de manera justa y equitativa.
La distribución justa de los
beneficios económicos de los recursos genéticos marinos ha sido un punto
clave del conflicto en las negociaciones. Y su resolución ha tenido que
esperar hasta el último día de las conversaciones. La sección del
tratado sobre Áreas Marinas Protegidas elimina la toma de decisiones
basada en el consenso, algo que no ha logrado proteger los océanos a
través de organismos regionales existentes como la Comisión del Océano
Antártico. Si bien todavía hay conflictos importantes en el texto, es un
tratado viable que es un punto de partida para proteger el 30% de los
océanos del mundo.
El objetivo 30×30, acordado en la
COP15 de Biodiversidad, no sería posible sin este tratado histórico. Es
vital que los países ratifiquen urgentemente este tratado y comiencen a
trabajar para crear vastos santuarios marinos totalmente protegidos que
cubran el 30% de los océanos para 2030.
A partir de ahora comienza el arduo
trabajo de ratificación y protección de los océanos. Debemos aprovechar
este impulso para deshacernos de nuevas amenazas, como la minería
submarina, y centrarnos en implementar la protección. Más de 5,5 millones de personas firmaron una petición de Greenpeace pidiendo un tratado ambicioso. Ésta es una victoria para todos ellos y ellas.
Estupendo noticia, que bueno. Ahora todo la gente tiene que hacer su parte.
El cancion de hoy: " Here comes the sun" de los Beatles
Sometimes climate change seems far away, then we’re hit with
heatwaves, droughts, floods and fires. 2022’s summer of disasters broke records.
Whether you cursed or loved the UK’s hot summer, there’s no shying away from the changes in our environment. Climate change and extreme weather affects us all and unfolds unequally across the world.
Yet climate disasters are often reported in isolation. We hear about
one after another in a parade of bad news. We hear about the lives lost,
the places destroyed and the urgent appeals for aid. It seems like it’s
getting worse. But rarely do news reports give us time to grasp the
scale of what’s happening.
If this summer or its headlines left you reeling, this article might
make you even angrier. We’re delving into the summer’s environmental
events to look at how the climate crisis is unfolding in front of us.
It’ll be bleak reading at times, but I want you to bear with me. Because
here’s the thing: there is a short time to do something to stop the
worst impacts. But we won’t want to take action if the climate crisis seems abstract, instead of something happening now. Welcome to 2022’s summer snapshot.
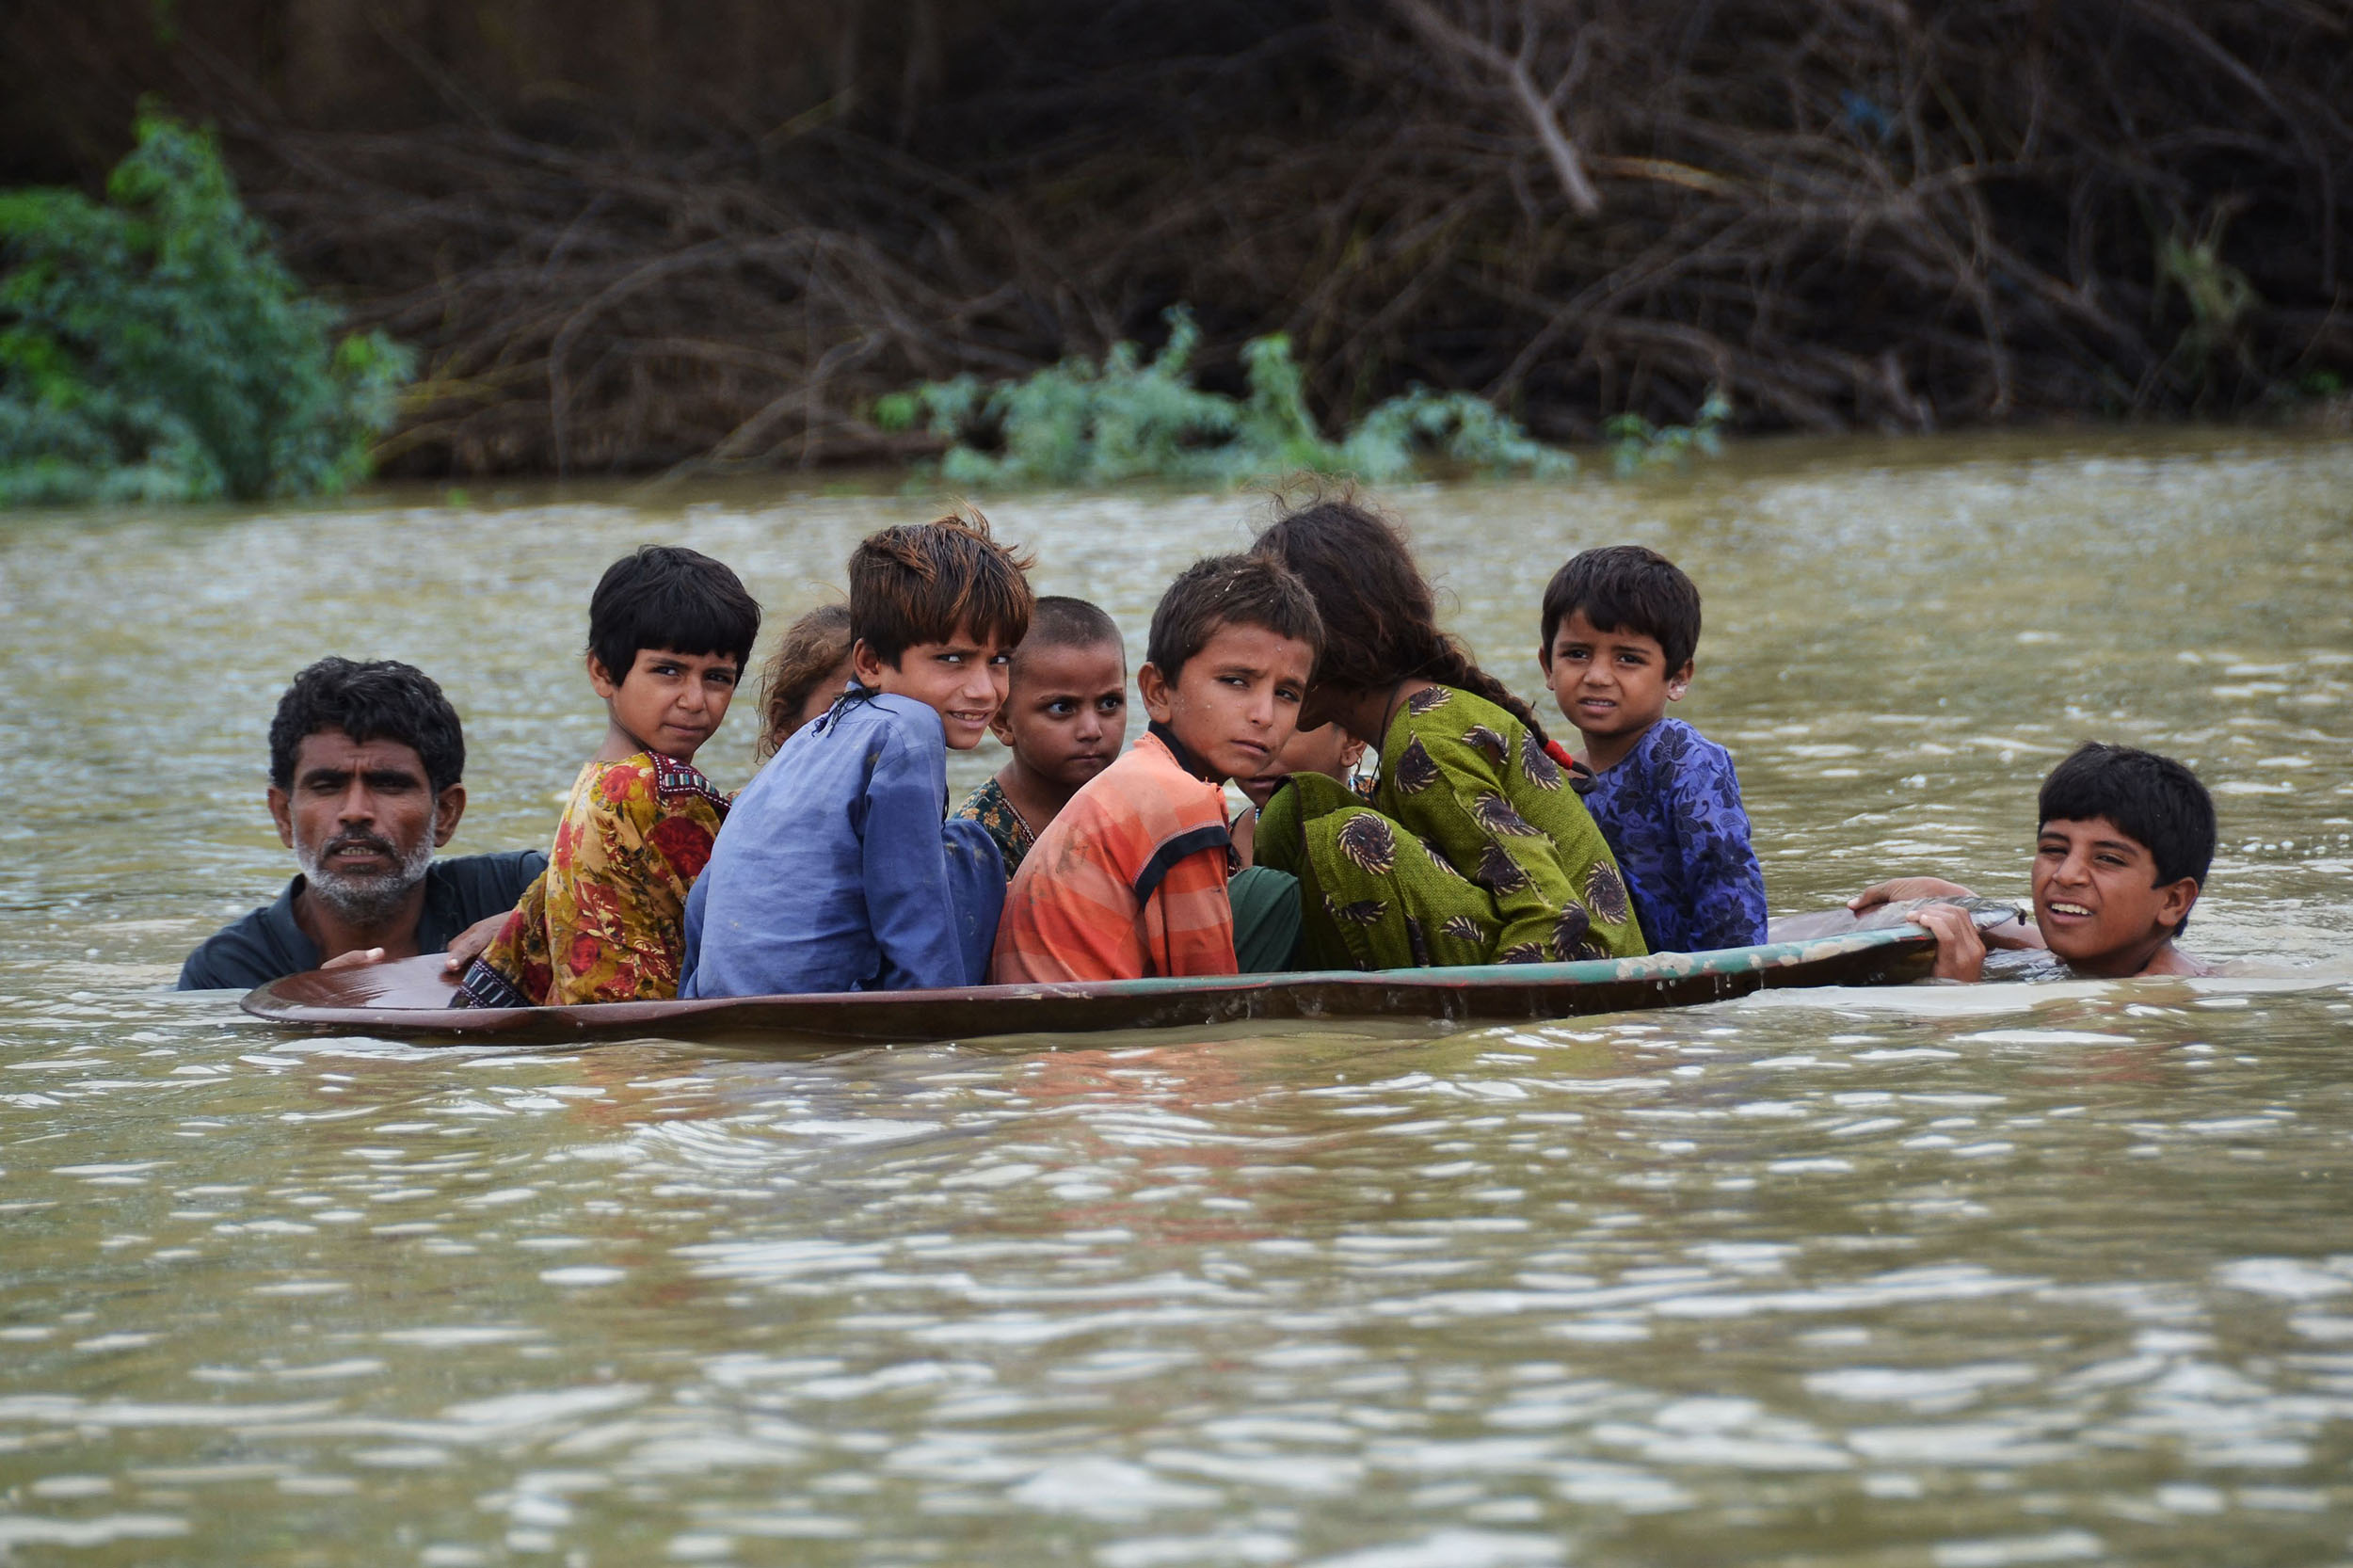
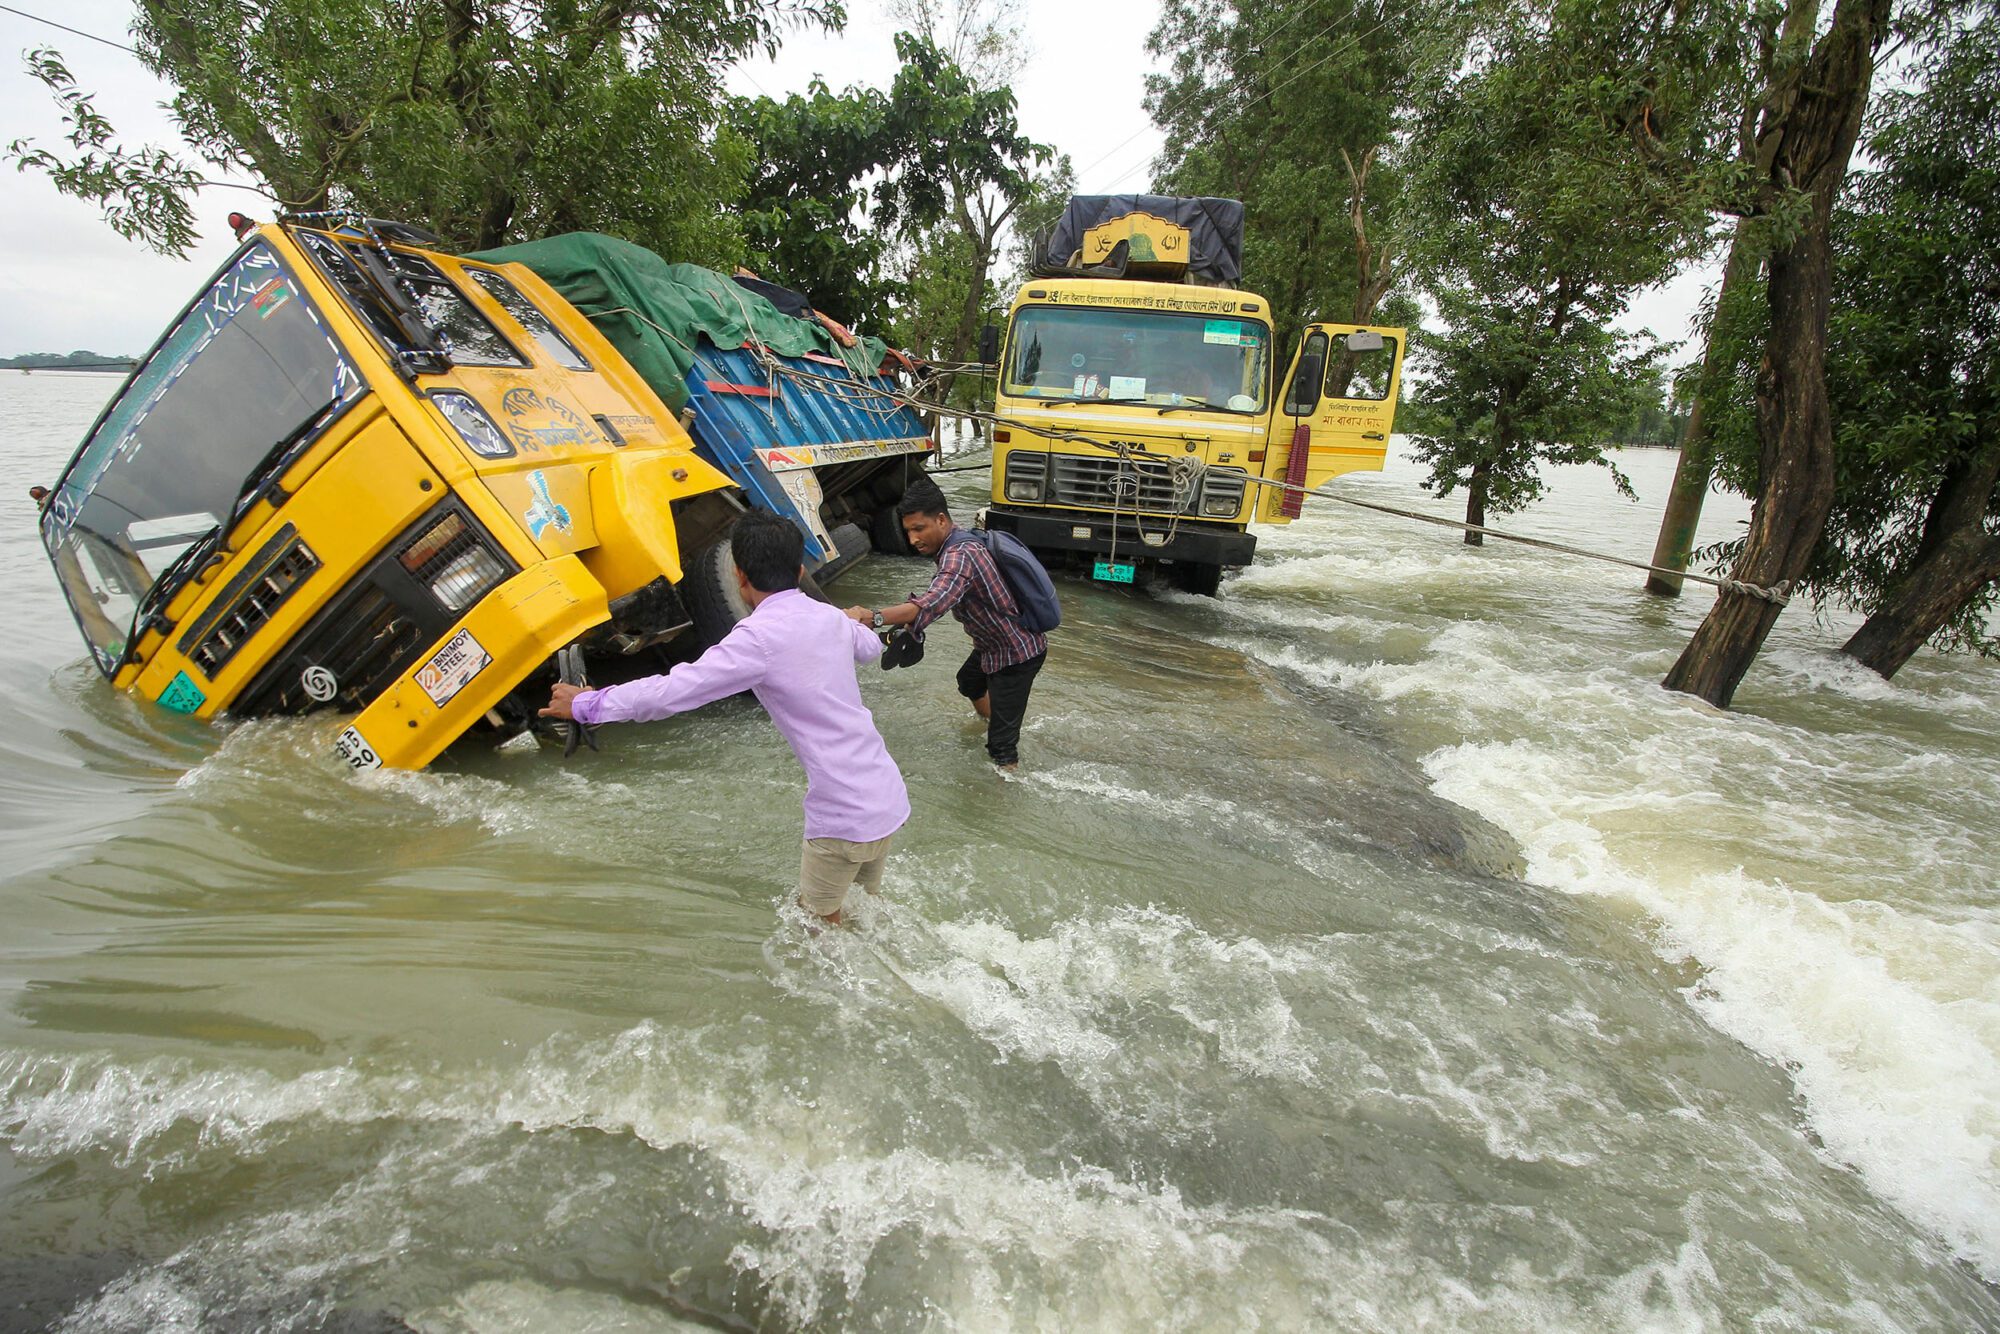
A
man and boy use a satellite dish to move children across a flooded
area.
Heavy monsoon rains pounded parts of Pakistan in August,
After eight weeks of non-stop rain, severe flooding has devastated
Pakistan. Over 1000 people are dead and millions have lost their homes.
Flash flooding and destroyed river banks are two reasons for the high
death toll. This monsoon has caused an enormous human disaster.
Pakistan is vulnerable to climate change.
Its location means it can experience heatwaves and drought, and intense
rains. Pakistan is also home to the most glaciers (huge ice sheets) in
the world outside of the north and south pole, which can melt as the
world gets hotter. Although Pakistan does get monsoon rains, the amount of rain this year was above average. Heavy rainfall and burst river banks made this year’s flooding extreme.
So is climate change to blame for this “monster monsoon”? Scientists say it’s likely. A rapid study suggests that rainfall may have been more intense due to global warming – a “monsoon on steroids”. This echoes analysis of Pakistan’s 2010 ‘superflood’ that “was made more likely by global heating, which drove fiercer rains.”
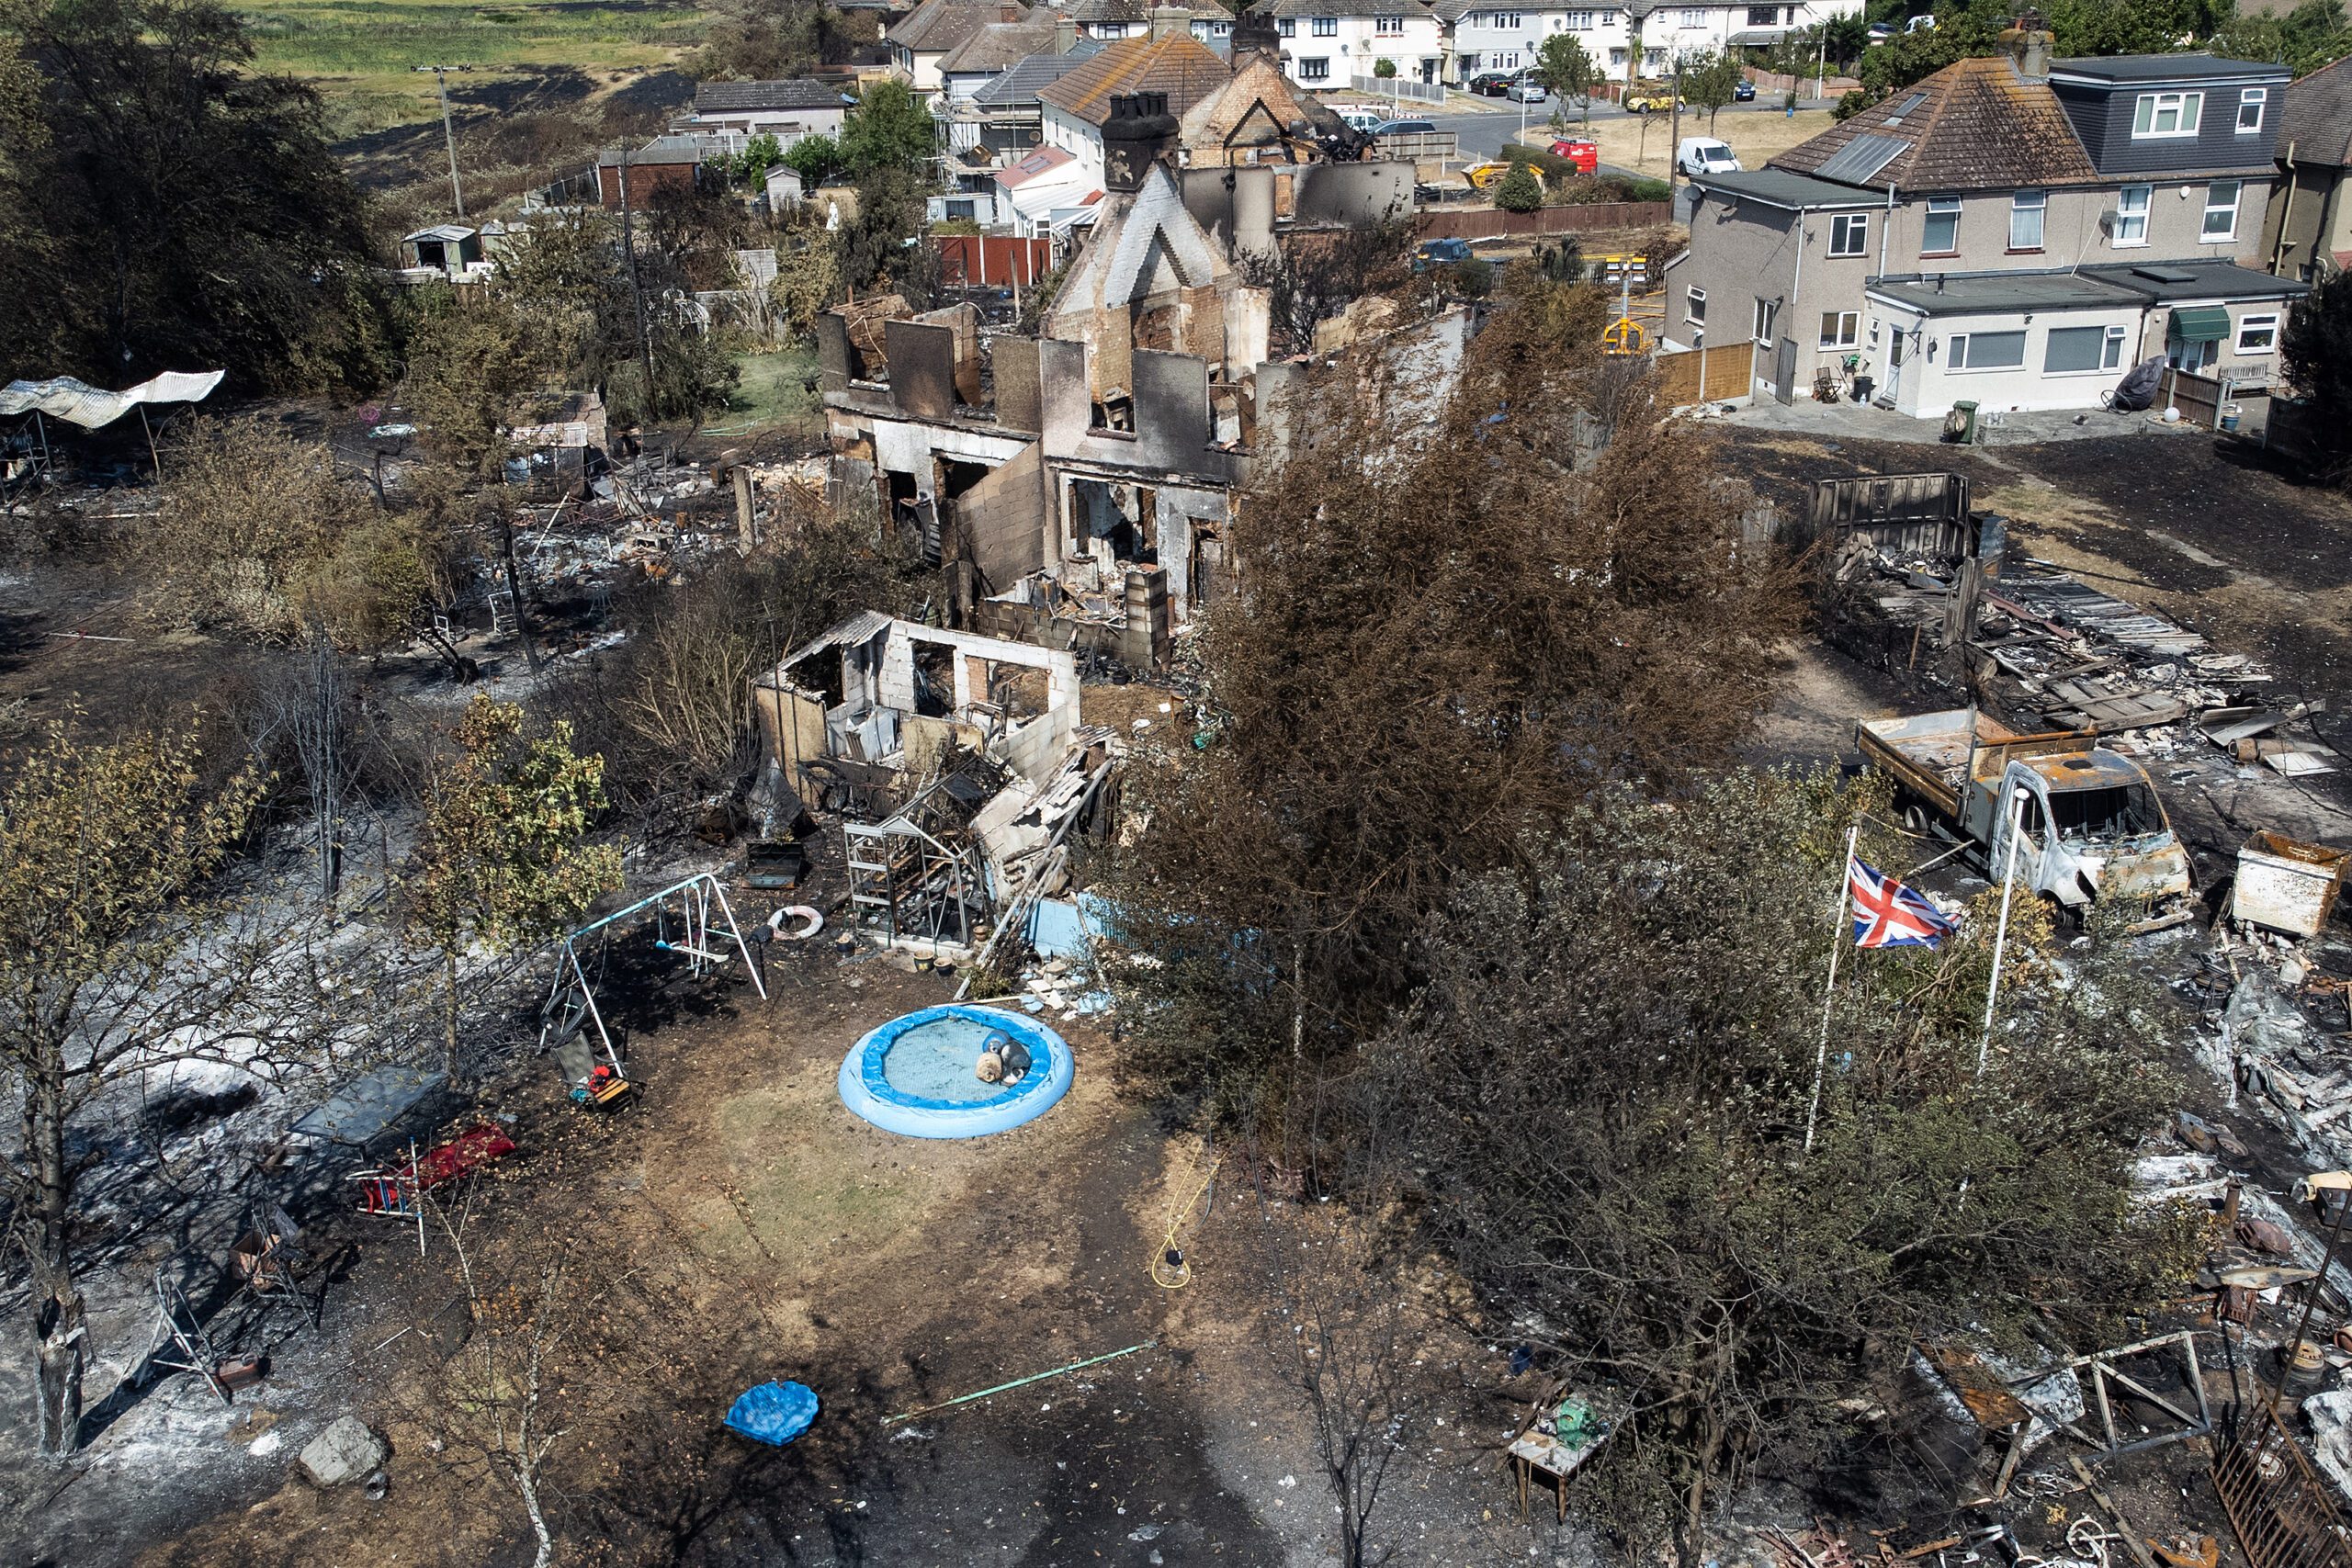
Rubble
and destruction of a UK housing estate after a large blaze.
Fires broke
out as the UK experienced a record-breaking heatwave.
The UK had two heatwaves this summer. It experienced its hottest temperature yet, hitting a new record-high of 40.3ºC. For some, it’ll have felt like a sunny holiday from the grey drizzle Britain is famed for. But for others, the sweltering levels of heat were difficult at best and life-threatening at worst.
As well as extreme heat, the UK has had 745 wildfires so far – more than the whole of 2021. UK wildfires may not be as extreme as places like Australia or North America, but they’re still tricky for firefighters to deal with.
How much of the UK’s heatwave was down to climate change? Well, recent analysis found climate change made the heatwave at least 10 times more likely and 4ºC hotter – and that’s a conservative estimate.
Extreme heat isn’t just happening in the UK. Earlier this year, India
and Pakistan suffered intense and record-breaking temperatures.
Scientists say these were 30 times more likely thanks to climate change. Their 2010 heatwave was made 100 times more likely by the climate crisis. Did you get that? 100 times! Likewise, scientists found the extreme heat in Canada and the US in 2021 was also “virtually impossible” without climate change.
Droughts causing food and water shortages worldwide
Europe is facing its worst drought for 500 years. A very dry winter and spring combined with record-shattering summer heat means there hasn’t been enough rain. With little rainfall, rivers are drying up and the soil is cracking, causing fish to die and crops to fail. And revealed by the drought, ‘hunger stones’ reading “If you see me then weep” chillingly warn of what may come.
It feels unsettling because it’s so close to home. But drought is affecting many countries beyond Europe too. Places like Somalia and Ethiopia are facing hunger and famine due to drought-caused food and water shortages. China saw the most severe heatwave ever recorded, causing parts of the country and its main river to dry up. It’s affecting water supplies, food and energy production, and may affect the rest of the world too. Parts of the US are also in a drought, as is Iraq. It’s happening all over the world, so how much is down to climate change?
Droughts don’t necessarily have one cause. They tend to build up over a period of time, rather than from a one-off weather event. But some scientific studies have found links between drought patterns and human-caused climate change.
With human influence seen in how intense drought and extreme rain
patterns are, and changes to tropical rain zones. More recent analysis
also shows the link between climate change and extreme weather events, like droughts.
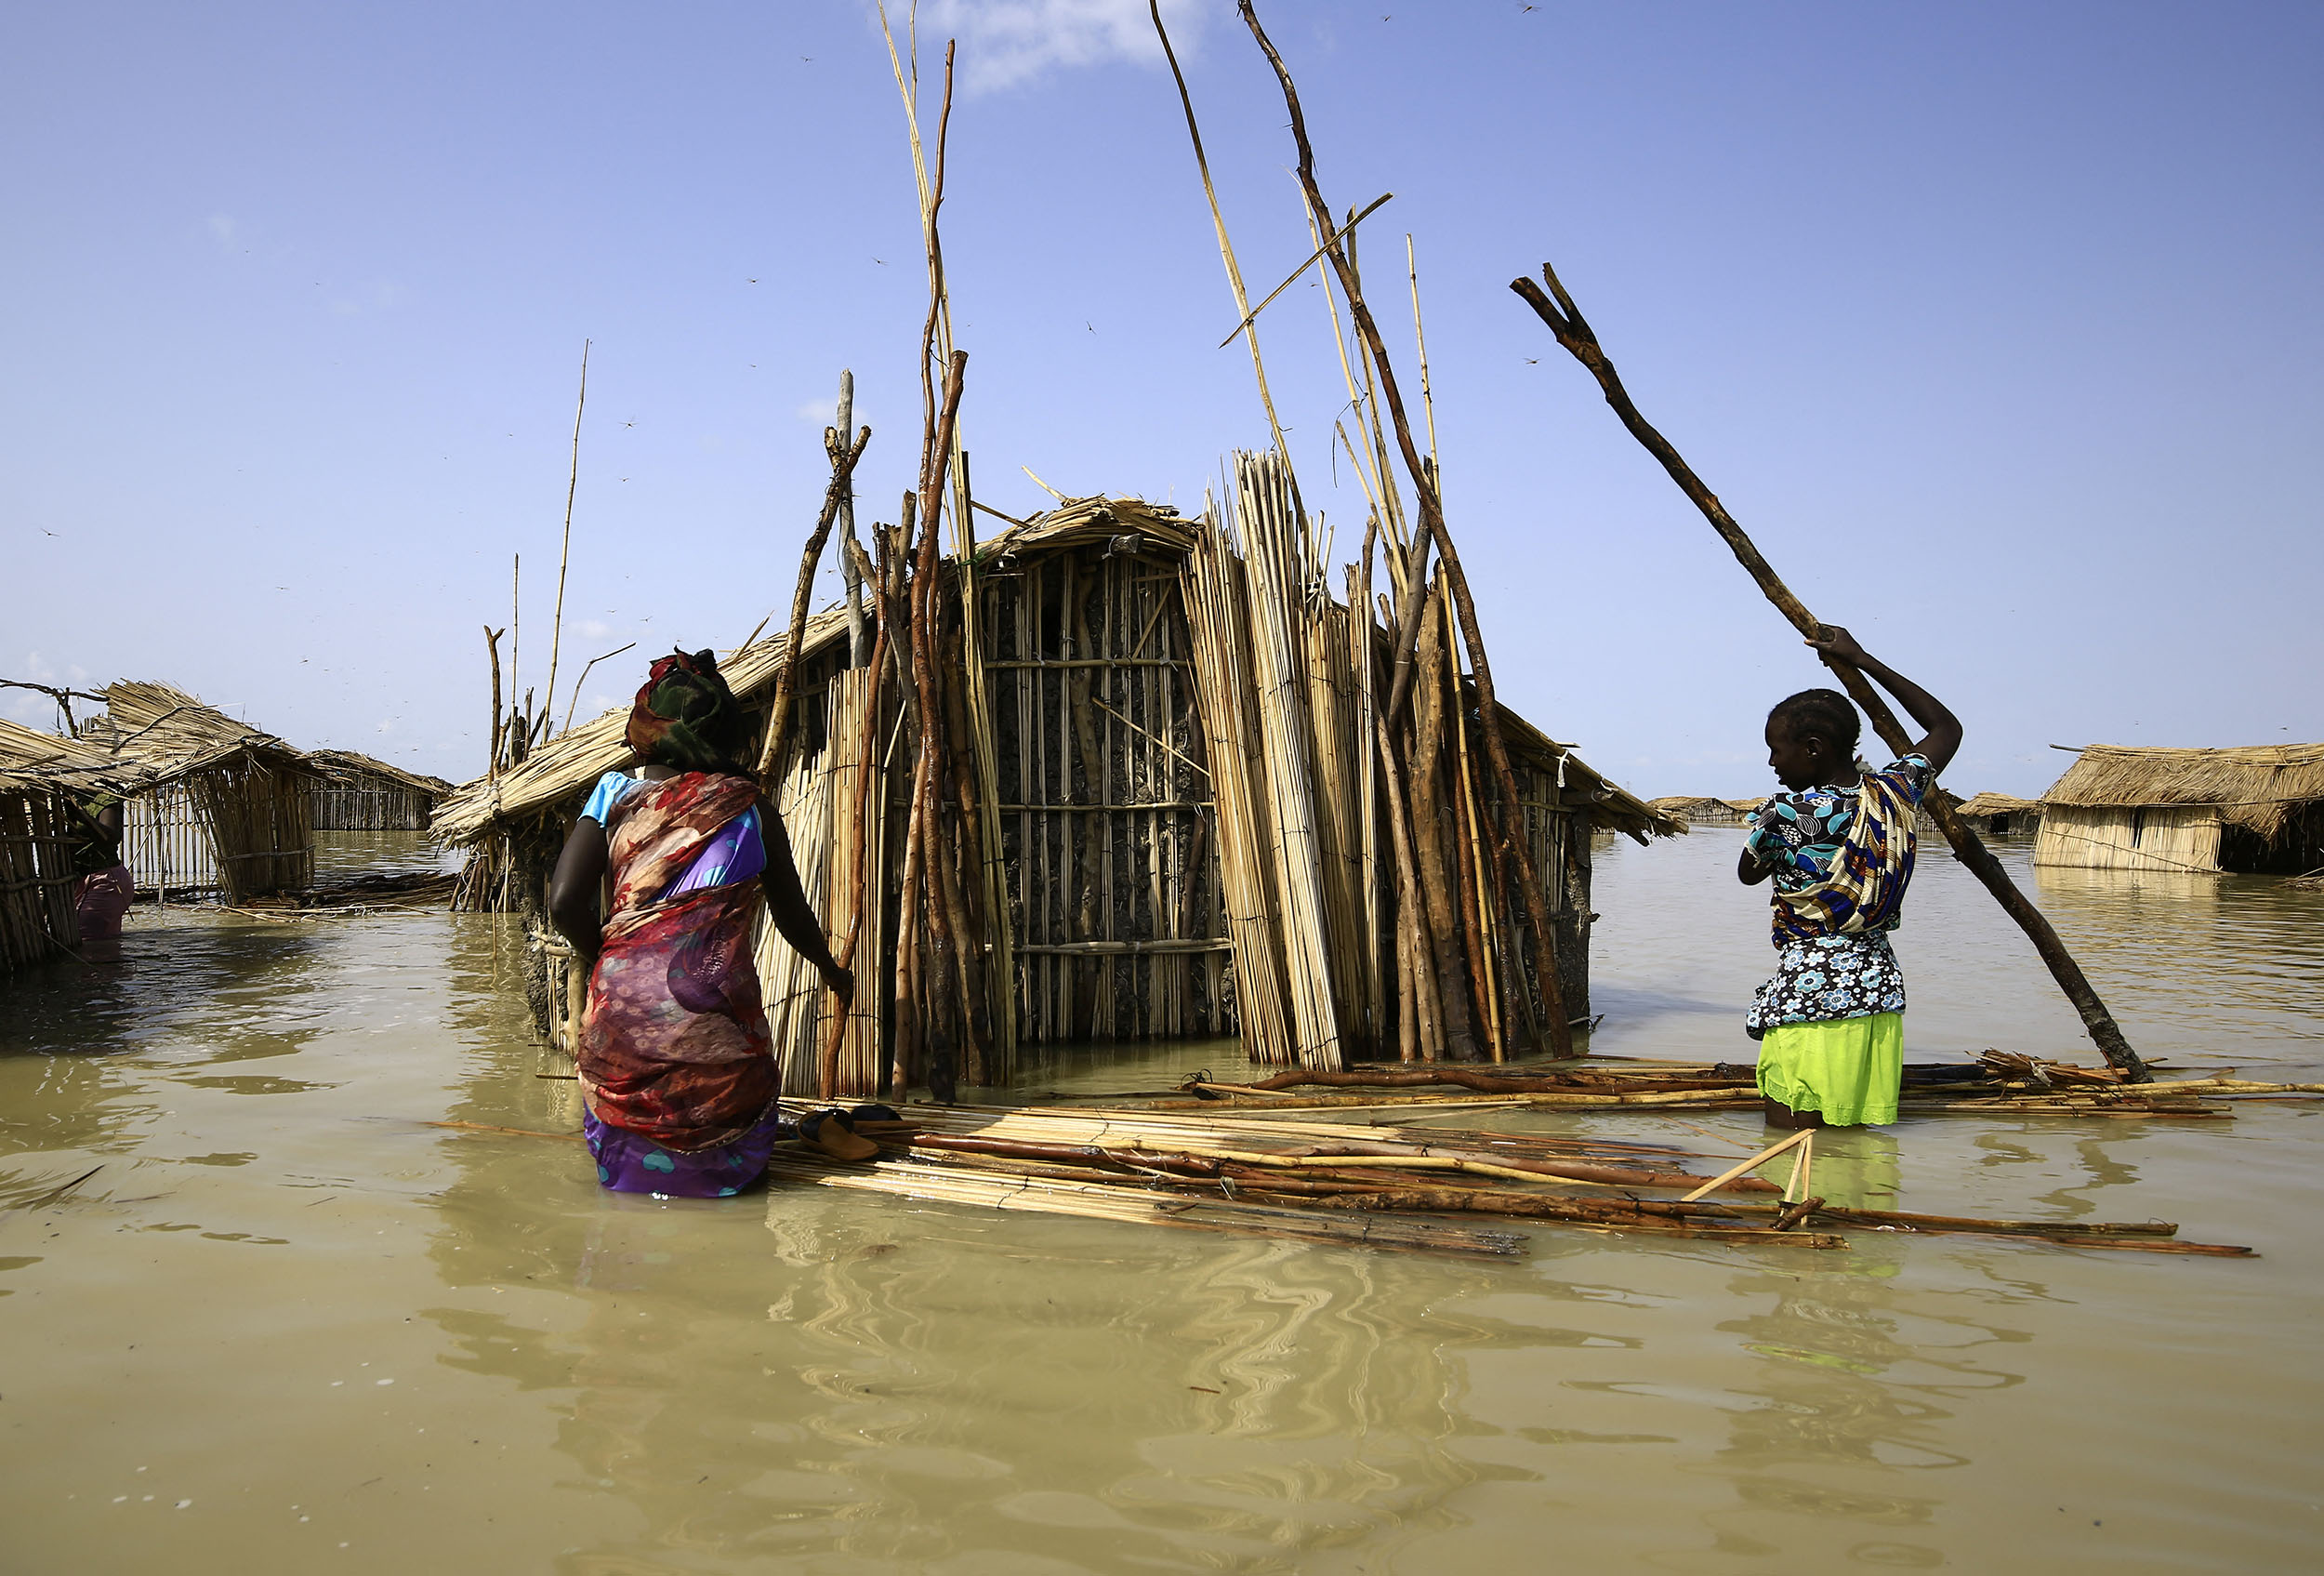
South
Sudanese refugees stand in flooded waters to repair their hut.
Heavy
rain submerged nearly 50 villages in South Sudan in 2021,
People lose homes after flooding in Sudan and South Sudan
Sudan saw one of its worst rainy seasons ever this summer. People
were forced to abandon their homes as the water flooded in and destroyed
everything. By the end of August, about 258,000 people were affected and more than 100 people died in Sudan. It’s another human crisis, which Sudan and South Sudan have seen before.
Extreme weather is becoming a pattern in the region. 2021 brought heavy rain and floods to South Sudan, which killed more than 80 people and swamped thousands of homes. In 2020, Sudan was declared a natural disaster area as floods killed about 100 people and destroyed homes and farmland. In 2019, flooding affected millions in South Sudan and several thousands in Sudan. Year on year of severe flooding means people are displaced over and over, with little time to rebuild between.
Sudan and South Sudan are among the most vulnerable to climate
change. As the planet warms, the region is expected to experience rain
that’s unpredictable. Rain may also be heavier, which increases risk of floods and waterborne diseases. As well as irregular and heavy rains, hotter temperatures mean droughts may happen more often. This affects farming, as water sources dry up and the land turns to desert. It puts enormous pressure on the people who live there. And is especially unfair as places like Sudan and South Sudan contribute the least to climate change, yet suffer the most.
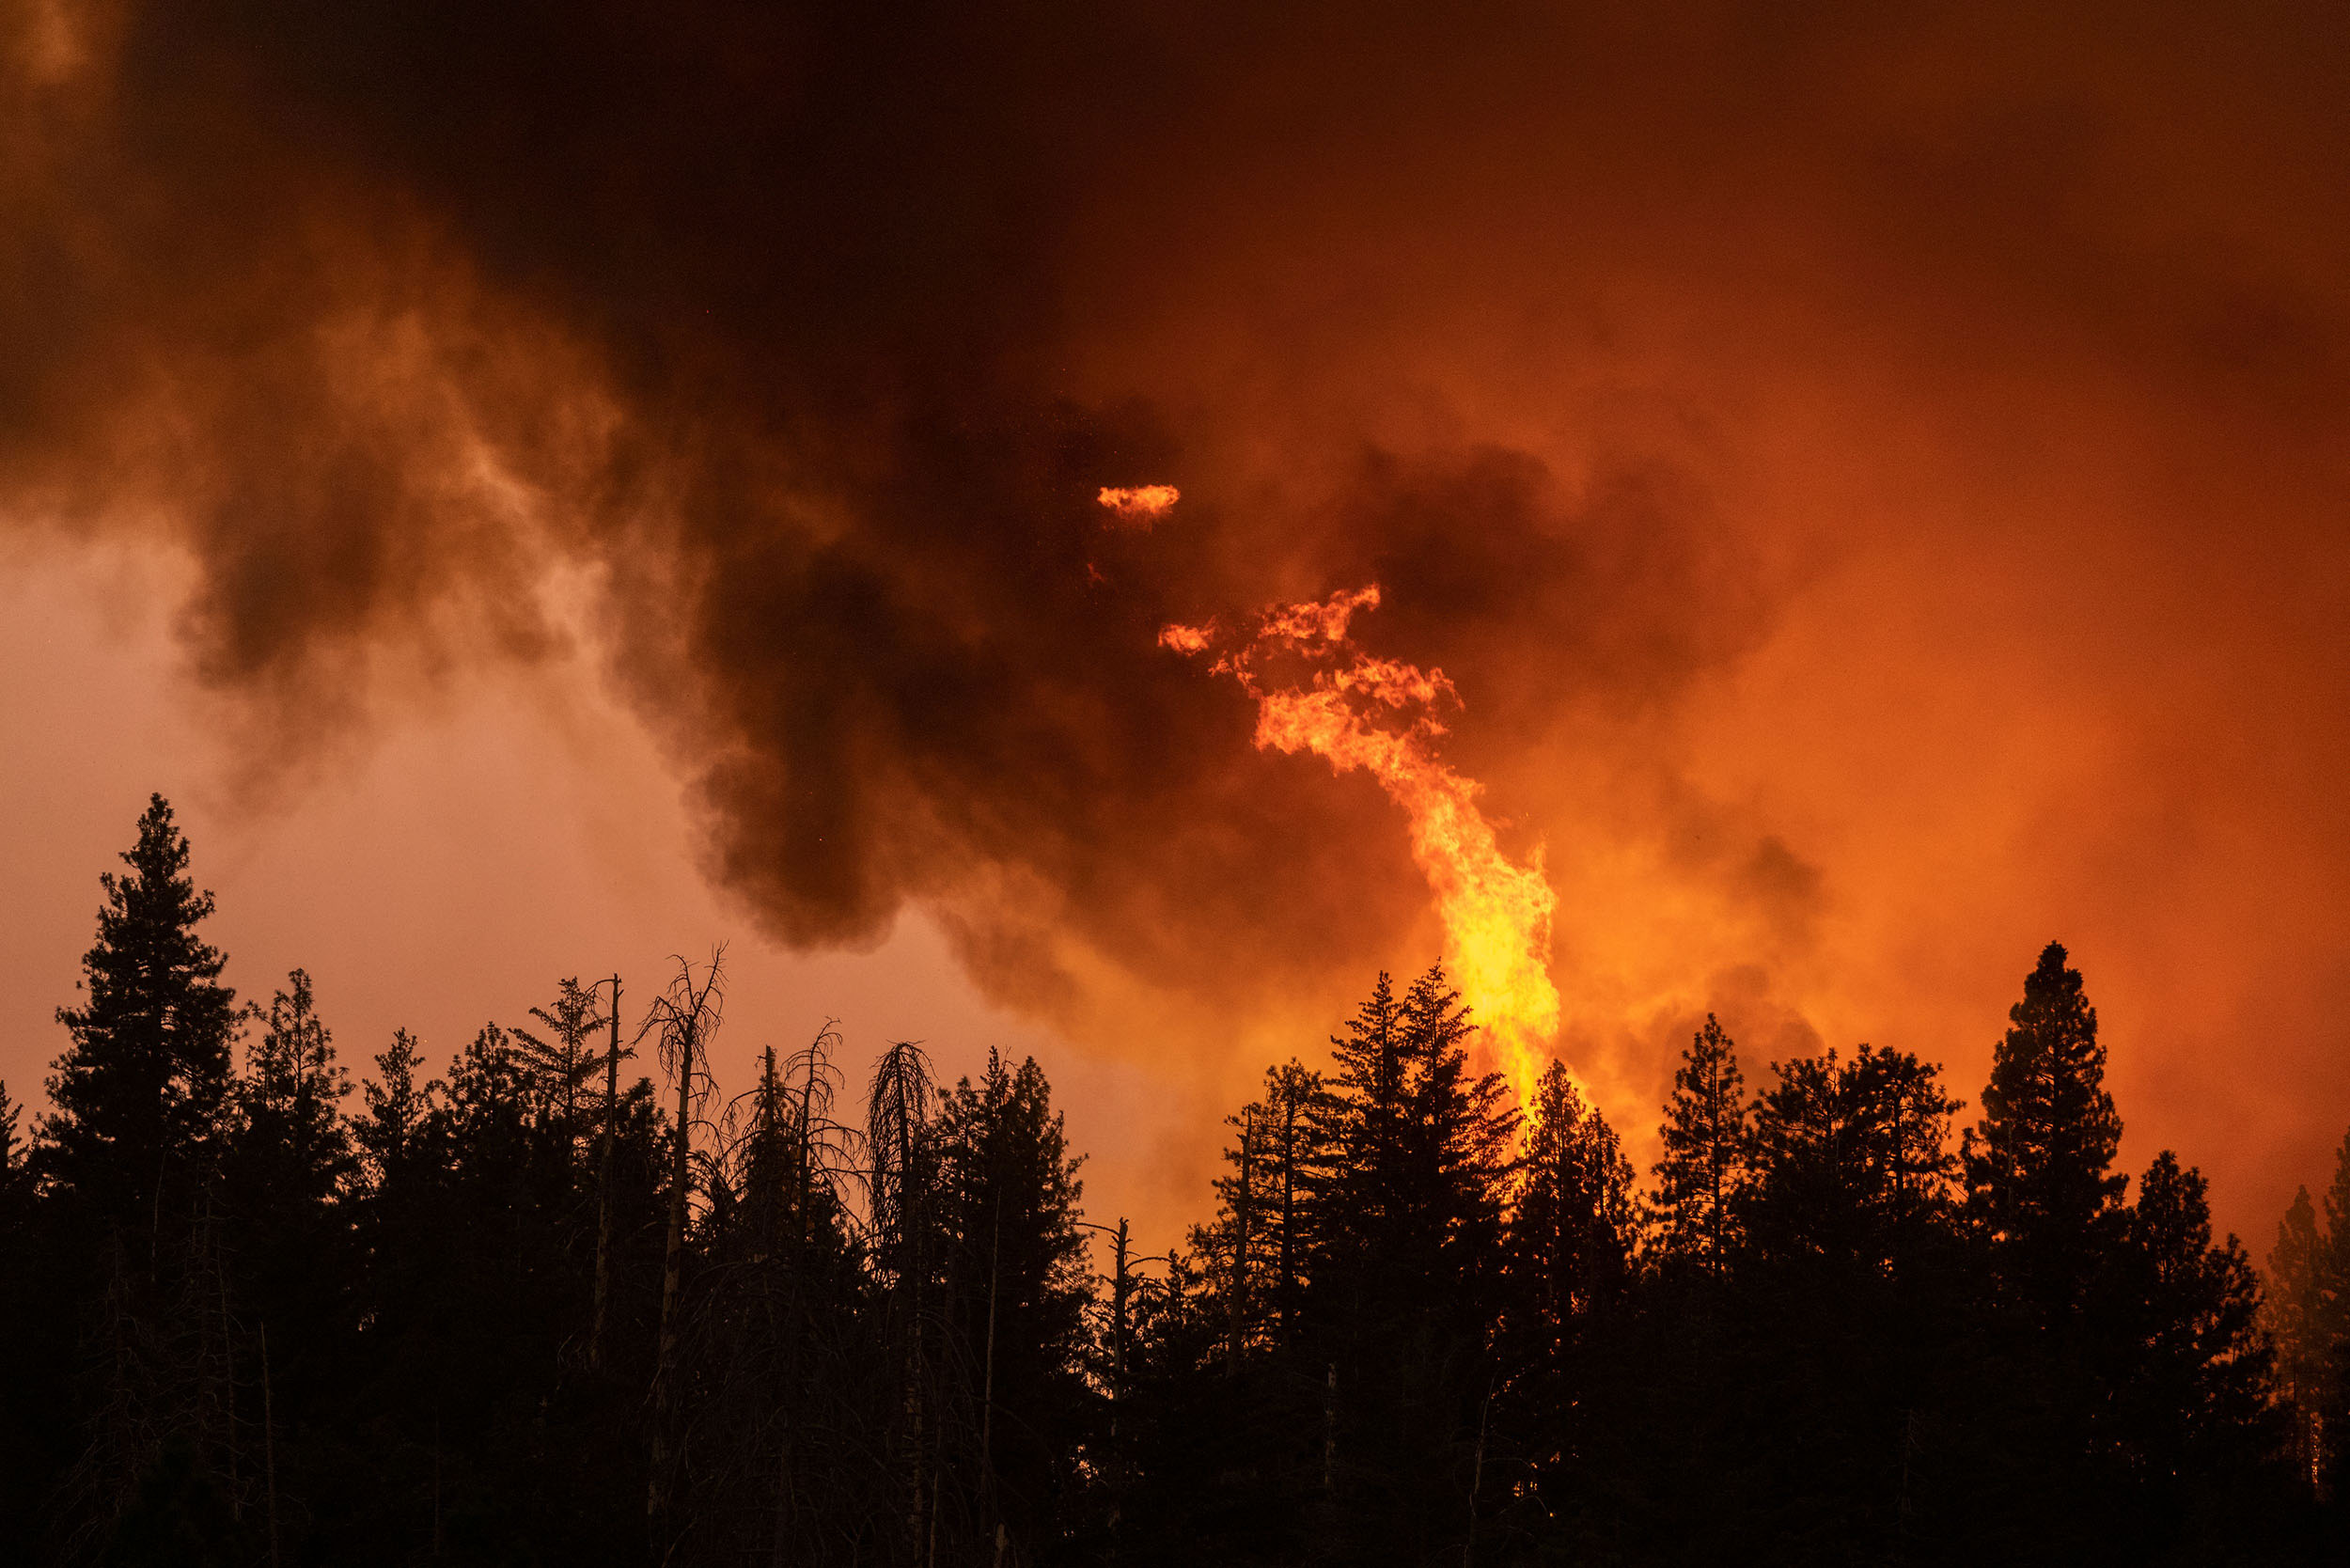
The
Oak Fire incinerates a forest in California.
The wildfire ripped
through thousands of acres in July following
Wildfires that are too fast to escape in California
Behind names like Creek, Dixie and Monument
are some of the many wildfires that California has faced in recent
years. This summer is no different as several wildfires erupted across
the region. McKinney is the largest; it burned about 60,000 acres of land, destroyed 87 homes and killed 4 people. Other fires have begun since then and reports say they’re becoming too fast to escape.
Of course, it’s not only the US that faces wildfires. Australia’s
‘Black Summer’ bushfires in 2019-20 were colossal. WWF declared them “one of the worst wildlife disasters in modern history”. And three years on, people who survived the fires are still waiting for homes. Fires also raze the Amazon, parts of Asia and even the Arctic. Though most wildfires happen in Africa.
As far as climate change goes, studies suggest that rising
temperatures create perfect conditions for fire. California’s wildfires
could turn into megafires, as hot, dry and windy days increase. Climate change is also making fire seasons last longer – Australia’s bushfire season is almost a month longer than 40 years ago.
While climate change affects wildfire risk differently for each region,
what we know is this: if the world keeps getting hotter, the risk of wildfires goes up and wildfire season gets longer.
In June, the worst floods for a century hit north-east Bangladesh and parts of India. The flooding killed over 100 people and stranded more than 9.5 million people across both countries, with the most affected in Bangladesh. And it happened as people were still recovering from flooding in May this year.
Monsoon rains are part of the rainy season that rages across south Asia in summer. But this year, the rain acted differently:
rains were heavier and began earlier than usual. People were unprepared
for intense rainfall and the region became engulfed by severe flooding.
How much was this change in rain behaviour down to climate change?
In general, it’s hard to fully predict how climate change will affect rainfall worldwide.
But scientists agree that south Asia is likely to get wetter. Like its
neighbours India and Pakistan, Bangladesh could experience both extreme
heat and extreme rain. Some experts warn that as temperatures rise, the risk of flooding goes up
in Bangladesh. Basically: dry days increase and rainy days may become
unpredictable and more intense. So it’ll rain less often, but when it
happens, it’ll pour hard.
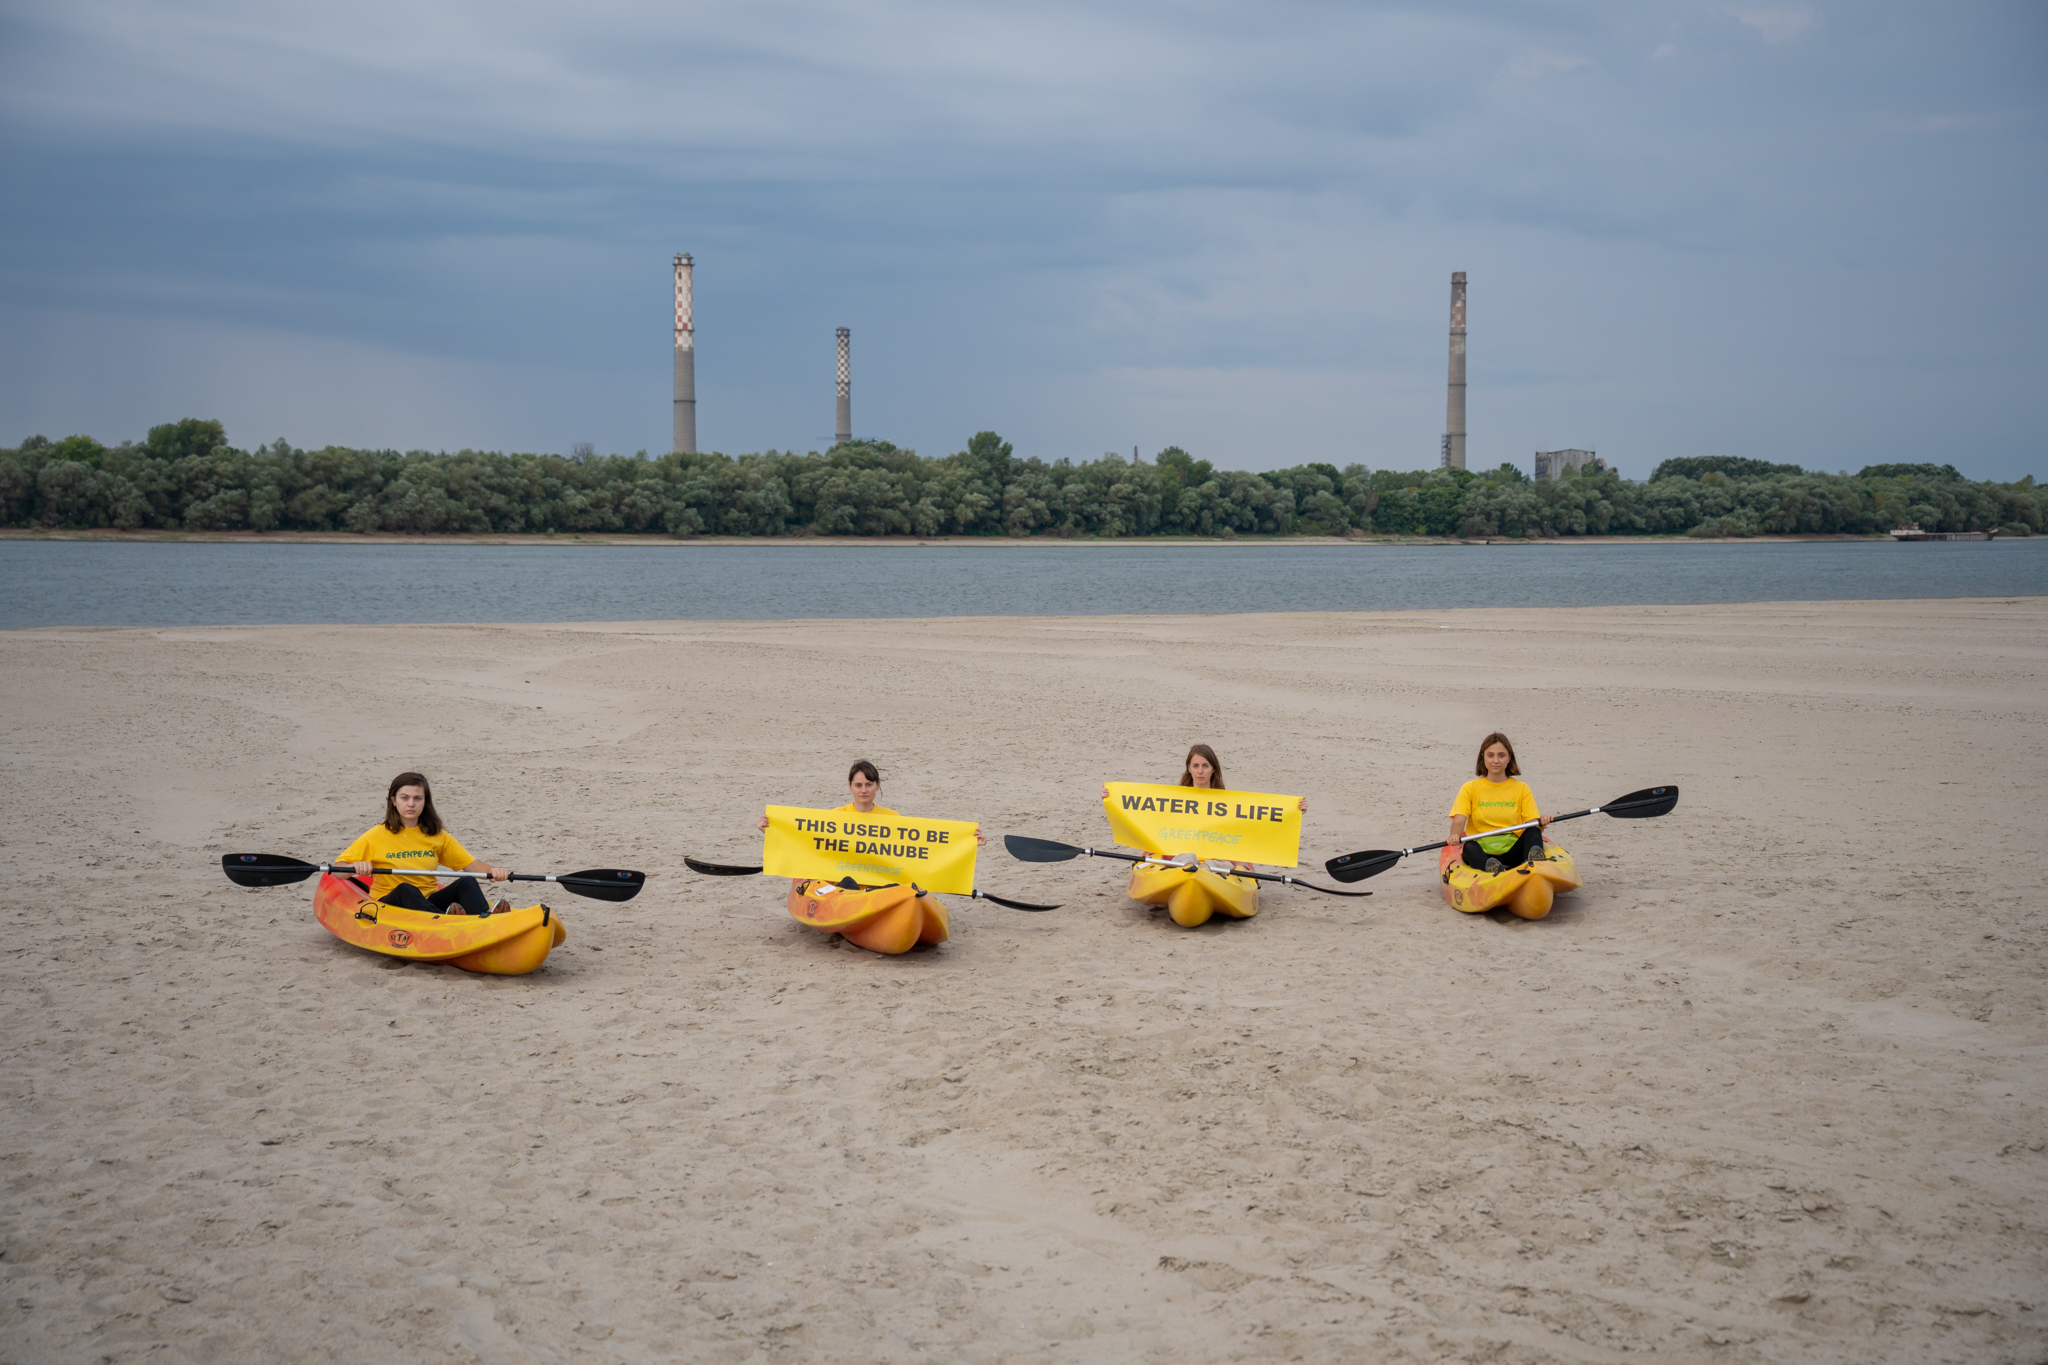
Greenpeace
Romania activists protest in the middle of the dried up
Danube
riverbed, halfway between Romania and Bulgaria.
Extreme weather may get worse – we need to act now
If 2022 shows us anything, it’s that extreme weather is here. Heatwaves, drought and floods are happening more often, and more intensely all across the world.
Records are getting broken each year, for a grave human and
environmental cost. We’re already feeling the impact. And extreme
weather events are set to become worse and happen more as the climate
crisis continues. So if you thought this year was bad for the climate,
the years coming could be worse.
Instead of sitting to wait for catastrophe, we need to act. We need
to pressure governments and corporations to act. We must wind down
fossil fuel use and cut emissions to avoid making the climate crisis
worse. Governments and corporations must do as much as possible, as
quickly as possible, to make this happen.
But we must also face up to what’s happening already. Doing nothing
makes it more expensive and harder to solve these problems in future. As
well as reducing emissions, we need to ramp up efforts to adapt to hotter, drier, wetter, fierier and stormier conditions worldwide. For the UK that means the government should invest in things like: insulating our homes
which should generally help keep them cool in summer, improving water
storage capacity so we can withstand drought, and improving
infrastructure like railways to cope with extreme weather.
This summer shows us we’re living with environmental extremes
already. Bringing these stories together shows us the scale of what’s
happening in the weather right now. So the question is, how will we act?
Take action
People like me have been screaming for something to be done for years,now the crisis is upon us please let something happen.
So far this year food prices have gone up, and supplies down, nearly everyone I know has cut down on their spending.
The blog song for today is: " Break on through (to the other side)" by the Doors.
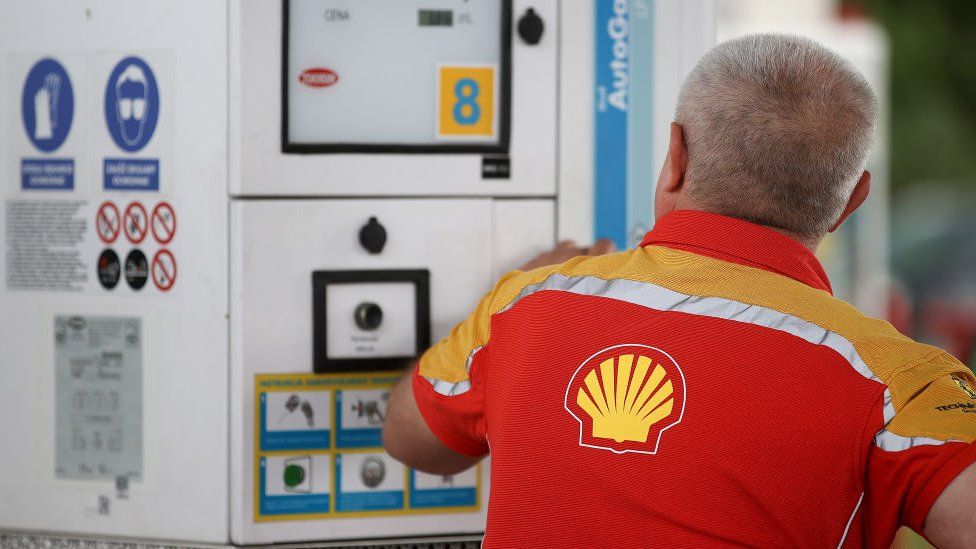
Oil
and gas giant Shell has reported record annual profits after energy
prices surged last year following Russia's invasion of Ukraine.
Profits hit $39.9bn (£32.2bn) in 2022, double last year's total and the highest in its 115-year history.
Energy firms have seen record earnings since oil and gas prices jumped following the invasion of Ukraine.
It has heaped pressure on firms to pay more tax as households struggle with rising bills.
Opposition
parties said Shell's profits were "outrageous" and the government was
letting energy firms "off the hook". They also called for the planned
increase in the energy price cap due in April to be scrapped.
Energy
prices had begun to climb after the end of Covid lockdowns but rose
sharply in March last year after the events in Ukraine led to worries
over supplies.
The
price of Brent crude oil reached nearly $128 a barrel following the
invasion, but has since fallen back to about $83. Gas prices also spiked
but have come down from their highs.
How much windfall tax are oil giants paying?
BP profit jump sparks calls for bigger windfall tax
White House calls Exxon record profit 'outrageous'
It has led to bumper profits for energy companies, but also fuelled a rise in energy bills for households and businesses.
Last year, the UK government introduced a windfall tax - called the Energy Profits Levy - on the "extraordinary" earnings of firms to help fund its scheme to lower gas and electricity bills.
Despite
the move, Shell had said it did not expect to pay any UK tax this year
as it is allowed to offset decommissioning costs and investments in UK
projects against any UK profits.
However, on Thursday it said was due to pay $134m in UK windfall tax for 2022, and expected to pay more than $500m in 2023.
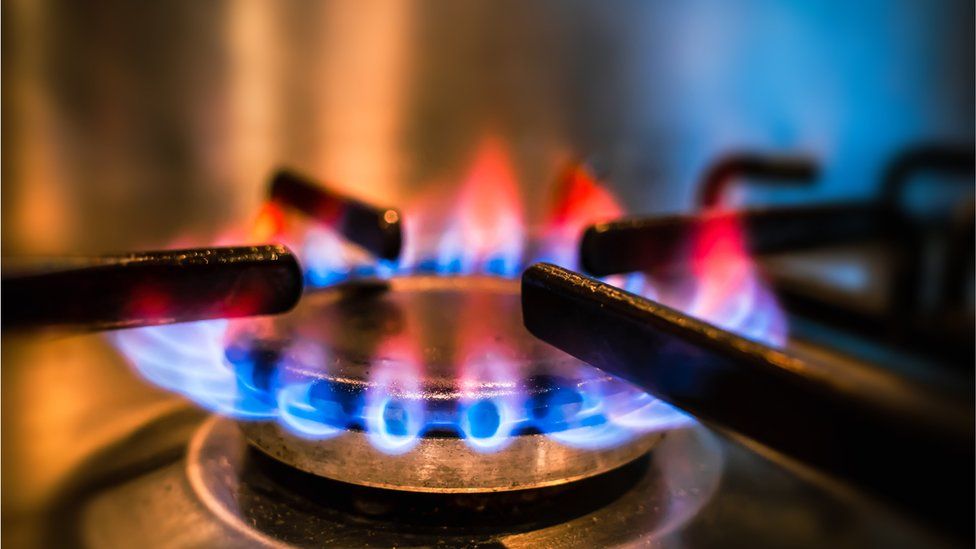
Image source, Getty Images
Image caption,
Gas prices spiked after Russia's invasion of Ukraine
This
may look small compared to its profits but Shell only derives around 5%
of its revenue from the UK - the rest is made and taxed in other
jurisdictions.
However,
critics point out that Shell is a UK-headquartered company and has been
paying more to its shareholders than it spends on renewable
investments.
The announcement has increased pressure on Rishi Sunak and Jeremy Hunt to raise more money from oil and gas profits.
A
Downing Street official said they "absolutely" understand anger at the
"extraordinary" profits but indicated there are no plans to increase the
windfall tax.
The prime minister's spokesman said questions about potential changes were "for the chancellor" when pressed by reporters.
The
government "is ready to take action" if falling wholesale energy costs
aren't reflected in lower prices at the petrol pump, the official added
without detailing specific measures.
The government is currently limiting gas and electricity bills so a household using a typical amount of energy will pay £2,500 a year.
However,
that is still more than twice what it was before Russia's invasion, and
the threshold is due to rise to £3,000 in April.
The
government's windfall tax only applies to profits made from extracting
UK oil and gas. The rate was originally set at 25%, but has now been
increased to 35%.
Oil
and gas firms also pay 30% corporation tax on their profits as well as a
supplementary 10% rate. Along with the new windfall tax, that takes
their total tax rate to 75%.
However,
companies are able to reduce the amount of tax they pay by factoring in
losses or spending on things like decommissioning North Sea oil
platforms. It has meant that in recent years, energy giants such as BP
and Shell have paid little or no tax in the UK.
'Fair share'
The
annual profit figure far surpassed Shell's previous record set in 2008.
The company also said it had paid out $6.3bn to its shareholders in the
final three months of 2022, and that it planned another $4bn share
buyback.
Shell
chief executive Wael Sawan said that these are "incredibly difficult
times - we are seeing inflation rampant around the world" but that Shell
was playing its part by investing in renewable technologies.
Its
chief financial officer Sinead Gorman added that Shell had paid $13bn
in taxes globally in 2022. It had also accounted for 11% of liquified
natural gas shipments into the EU, easing pressure on supplies caused by
sanctions on Russia.
Labour's
shadow climate change secretary Ed Miliband said: "As the British
people face an energy price hike of 40% in April, the government is
letting the fossil fuel companies making bumper profits off the hook
with their refusal to implement a proper windfall tax.
"Labour
would stop the energy price cap going up in April, because it is only
right that the companies making unexpected windfall profits from the
proceeds of war pay their fair share."
Liberal
Democrat leader Ed Davey said: "No company should be making these kind
of outrageous profits out of Putin's illegal invasion of Ukraine.
"They must tax the oil and gas companies properly and at the very least ensure that energy bills don't rise yet again in April."
TUC general secretary Paul Nowak called for ministers to impose a larger windfall tax, adding: "The time for excuses is over."
He
continued: "Instead of holding down the pay of paramedics, teachers,
firefighters and millions of other hard-pressed public servants,
ministers should be making big oil and gas pay their fair share."
This is so very wrong, how can governments keep on denying there is anything amiss? Maybe because as we are all finding out half of the MP's are shareholders in these companies.
The blog song for today is: "Anarchy in the UK" by the Sex Pistols